Tool Screen Layout
Introduction
This section introduces the screen layout and operation methods of TimeTracker Analytics.
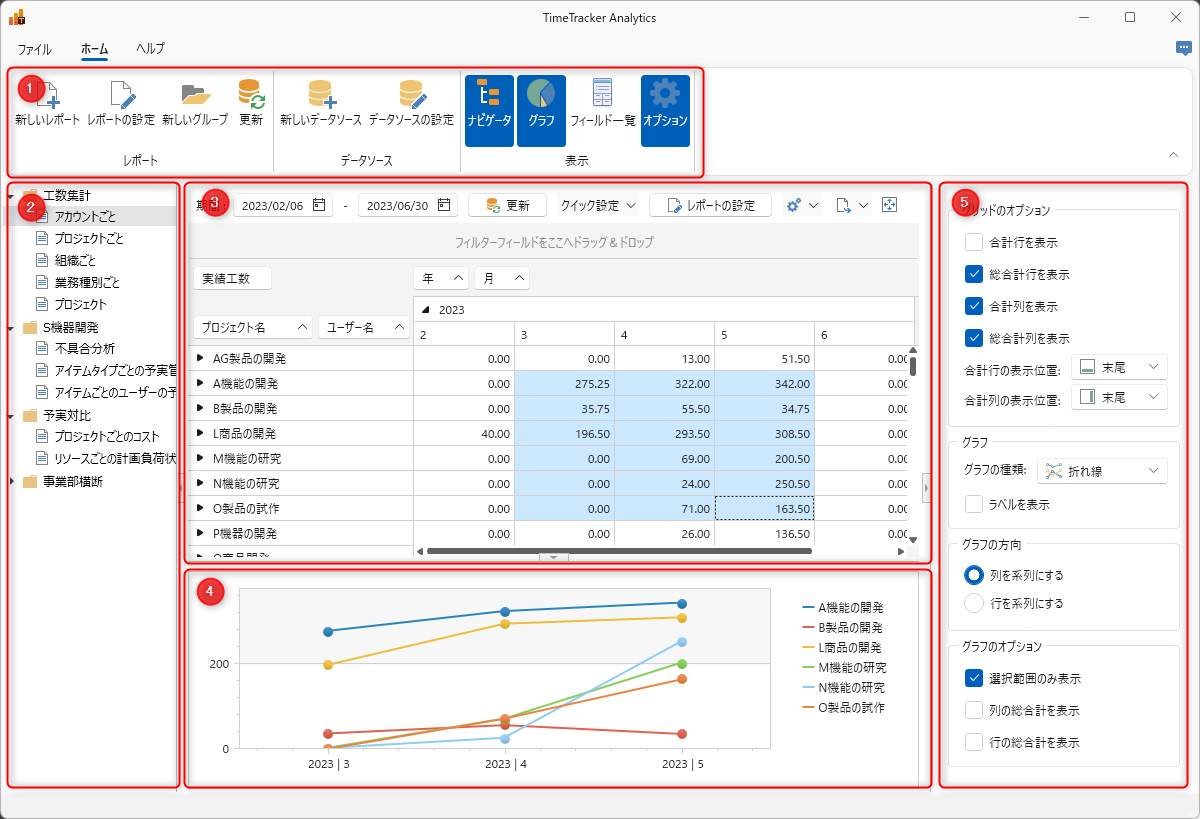
It can be broadly classified into the following five categories.
Please refer to the link for details.
| No | View | Link to Description |
|---|---|---|
| ① | Ribbon | ■ |
| ② | Navigator | ■ |
| ③ | Report | ■ |
| ④ | Graph | ■ |
| ⑤ | Display Options | ■ |
Ribbon
The following three tabs are available:
- File: "Export to External"
- Home
- Help
The following provides details on the Home and Help tabs.
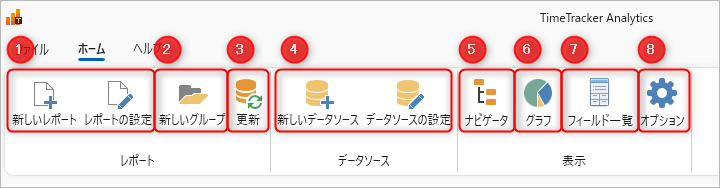
Home Tab
| No | Description | Link to detailed explanation |
|---|---|---|
| ① | Create a new report and change the settings of an already created report. | Create an analysis report |
| ② | Create a group of reports. | Navigator |
| ③ | Retrieve data for the selected report from the TimeTracker RX database. | - |
| ④ | Create a data source. | Configure data source |
| ⑤ | Toggle the display/hide of the navigator. | Navigator |
| ⑥ | Toggle the display/hide of graphs. | - |
| ⑦ | Toggle the display/hide of the field list. | Manipulating Analysis Reports |
| ⑧ | Toggles the display/hide of the options settings screen. | Display Options |
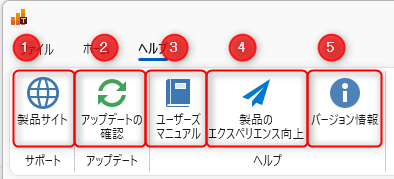
Help Tab
| No | Description | Link to Detailed Explanation |
|---|---|---|
| ① | Opens the TimeTracker RX product site page. | - |
| ② | Checks for the availability of the latest version. | Manually Upgrade |
| ③ | Opens the TimeTracker Analytics manual. | - |
| ④ | Sets whether or not to provide information on tool usage. | Information Gathering Regarding Usage Status |
| ⑤ | Check version information, license agreement, and third-party information. | - |
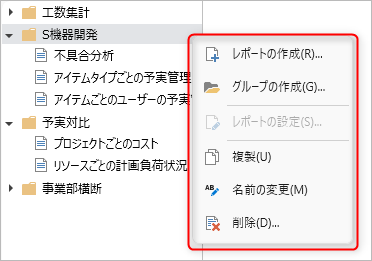
Navigator
Displays a list of reports.
The reports you create will be displayed in this section.
Select the location where you want to create a group and create it using one of the following methods:
- Click the "New Group" button on the ribbon.
- Right-click and click "Create Group".
The created group can be operated in the following ways:
- Move its location by dragging and dropping.
- Right-click to display the operation menu.
Display Options
There are two options below.
Please refer to the linked pages for details.
- Grid (Analysis Report): Manipulate Analysis Reports
- Graph: Display as Graph
Now let's actually manipulate the analysis table.
Shortcut Keys
The following shortcut keys can be used on the TimeTracker Analytics screen.
Ribbon
| What you can do | Shortcut key |
|---|---|
| Create a new report | Ctrl+N |
| Create a new group | Ctrl+Shift+N |
| Update report | F5 |
| Show navigator | F6 |
| Show graph | F7 |
| Launch field list dialog | F8 |
| Show options | F9 |
Editing operations
| What you can do | Shortcut key |
|---|---|
| Full screen/Return | F11 |
| Open report settings | Double-click report element in navigator |
| Rename | F2 in group or report in navigator |
| Delete | Delete in group or report in navigator |
| Select all | Ctrl+A in navigator |
| Select range | Shift+up, Shift+down in navigator |
| Move order between sibling nodes | Alt+up, Alt+down in navigator |