Managing progress across projects
Overview
You can display Gantt charts for multiple projects side-by-side.
- You don't need to open the project management screen individually; you can view them all on one screen.
- You can specify the projects to display, and for viewing purposes, this screen is all you need.
- For managers overseeing multiple projects, displaying the Gantt charts for projects under your jurisdiction
in a single view makes daily project management significantly more efficient.
We will explain the features related to displaying Gantt charts for multiple projects.
- Gantt charts cannot be displayed.
- Only projects are displayed; work items cannot.
Common Procedure
To manage progress across projects, perform the following steps as a common prerequisite:
-
Click "Analysis" in the global navigation.

-
Click "Cross-Project" in the local navigation.
Setting and Displaying Projects
You can set the projects to display in the Gantt chart as a view, displaying only the necessary projects.
You can create multiple views to match the information you need to check, such as by organization or by person in charge, and easily switch between them.
Operating Procedure
-
Click the "Add View" icon ① on the toolbar on the left side of the screen.

-
In the "Basic Information" tab of the "Project Cross-View Settings" dialog, enter a "Name".
-
Click the "Target Data" tab in the "Project Cross-View Settings" dialog.
-
Add the target project using the "Add" icon ②.

-
Click the "OK" button.
-
Select the created view ③.

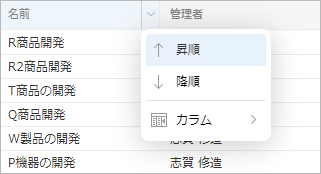
Sorting the List
The "Select Project" dialog allows you to sort and display the list in ascending or descending order based on the values in each column.
The sorting procedure is as follows:
- Click the rightmost column of any column in the header row of the project list.
- Select "Ascending" or "Descending" from the menu that appears.
Changing the Displayed Columns in the Selection Dialog
The "Select Project" dialog allows you to toggle the display of each column.
By default, the project category columns are hidden.
To show columns or hide unnecessary columns, follow these steps:
-
In the header row of the project list, click the rightmost edge of the desired column.
-
From the menu that appears, select "Columns" and check the columns you want to display. Uncheck the columns you want to hide.

Grouping Created Views
Created views can be grouped by any unit, such as business area.
Grouping makes it easier to find the desired view.
Operating Procedure
-
Click the "Add Group" icon ① on the toolbar on the left side of the screen.

-
Enter a name for the newly added group.

You can add a new view by selecting the added group.
You can move existing views to the group by dragging and dropping them.
Changing the View to Display
Changing the Fields to Display
You can customize the fields displayed across projects.
-
You can make it easier to read by displaying only the necessary information.
For instructions on how to customize the fields to display, please refer to the following link: "Switching the Table to Display" -
When custom fields are displayed, values will not be displayed in the project rows.

For details, please refer to the following link: "Export/Import Table Settings"
Filtering the Projects to Display
There are two ways to narrow down the projects to display.
- Set and Display the Projects to Display
- Further narrowing down after selecting the projects configured in 1
Here, we will explain method 2 above.
By selecting the filter in the image below, the corresponding projects will be displayed.

Example) If "Incomplete" is selected: If the project is incomplete, completed items within the project will also be displayed.
Exporting/Importing Table Settings
The table settings configured in "Change Displayed Fields" can be exported as a settings file.
Other users can import this settings file to reference cross-project information in the same table.
Both exporting and importing table settings are performed in the "Table Definition" dialog box.
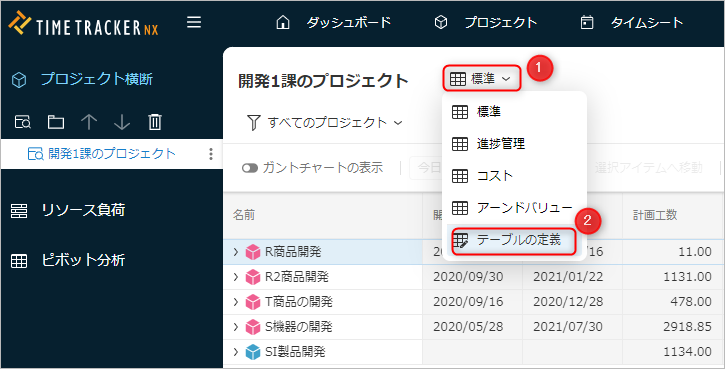
-
Click the currently selected table name ①.
-
Select "Table Definition" ②.
Exporting Table Settings
Follow the following steps:
-
In the "Table Definition" dialog box, select the table to export and click "Export".

-
In the "Save As" dialog box, specify the folder and file name to save the exported file.
-
Click the "Save" button.
A file with the extension "gantt_tabledef" will be created in the specified save location.
Importing Table Settings
Follow the following steps:
-
In the "Table Definition" dialog box, click "Import".

-
In the "Import" dialog box, click "Select File".
-
In the "Open" dialog box, select the file to import (extension: gantt_tabledef) and click "Open".
-
In the "Import" dialog box, click "OK".
-
In the "Table Definition" dialog box, click "OK".
The imported table will be added to the end of the table list.
Please export the table configuration file again.
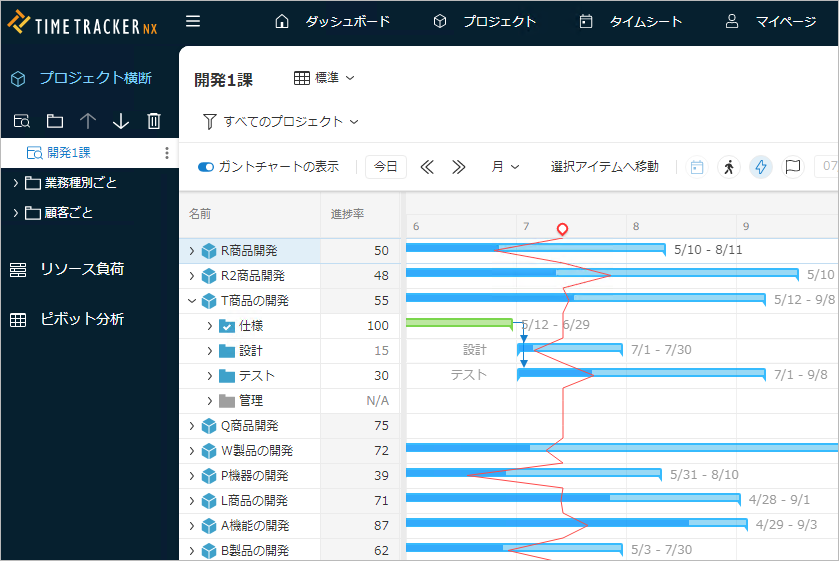
Displaying Project Progress on a Gantt Chart
In cross-project configuration, you can display multiple projects side-by-side on a Gantt chart to check their progress collectively.
The following can be displayed on the Gantt chart:
-
Displaying Lightning Bolt Lines
Lightning bolt lines represent the delay or progress of each item relative to the plan.
Lightning bolt lines allow you to check the progress of each task on the Gantt chart.
The relationship with the Today Line (the line indicating today's position) allows for an intuitive understanding of the situation.- If on the left: It is behind schedule.
- If it's on the right: It's ahead of schedule.
-
Display the baseline
The baseline saves project information from a past point in time and serves as historical planning information.
You can compare the current plan with past plans and see the differences on the Gantt chart.
The baseline is automatically saved daily. -
Display the actual line
The actual line represents the period during which actual man-hours have been entered.
You can check whether work is being carried out according to the plan.
The Gantt bars for the planned period and the actual line are displayed on the Gantt chart for comparison.
Copying data in tab-separated format
Information displayed on the TimeTracker RX cross-project screen can be copied in tab-separated format (TSV format).
By pasting project list information managed in TimeTracker RX into reports such as Excel,
you can use it as input information for project data used in other systems.
Operating Procedure
-
Select the projects or items to output.
-
Right-click on the selected work item.
-
From the menu that appears, select "Copy items in TSV format".
The fields copied will be all fields in the selected row.
-
Paste the copied data into Excel using Ctrl + V, etc.
The data of the copied fields will be pasted, separated into individual cells.