Track your progress
Overview
You can visualize and check the project progress on a Gantt chart.
This page will introduce the following:
- How to enter actual data for items
- Techniques for checking progress on a Gantt chart
- How to manage progress
Entering the progress rate of items
TimeTracker RX has a mechanism to visualize the project status for progress management.
So, let's start by entering the progress rate.
Entering Progress Rate on the Project Screen
You can also update the "Progress Rate" for each item on the project screen, which can be used in the following situations:
- Updating progress while checking the project plan.
- Reflecting the progress of each task in the project while checking the status of the person in charge at the project progress meeting.
Double-clicking the progress rate field of the target work item will make it editable.
After entering a number, press Enter to reflect the entered value.
Entering Progress Rate on the Timesheet Screen
You can also update the progress rate of work items from the timesheet.
- The progress rate is entered from the item properties, which display the detailed information of the work item.
- Updating the information in the item properties directly updates the project information.
Since you can update the progress rate of each task while entering actual results on the timesheet screen,
You can perform multiple tasks without switching screens.
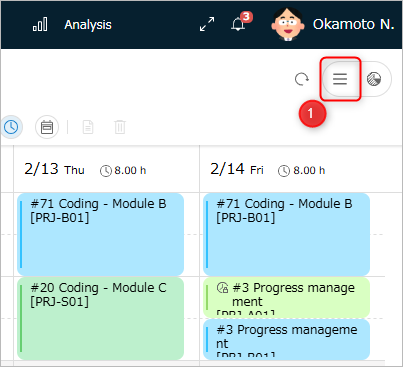
You can update from the item properties using the following operations.
-
Click the "Item Properties" button ① in the upper right corner of the timesheet screen.
-
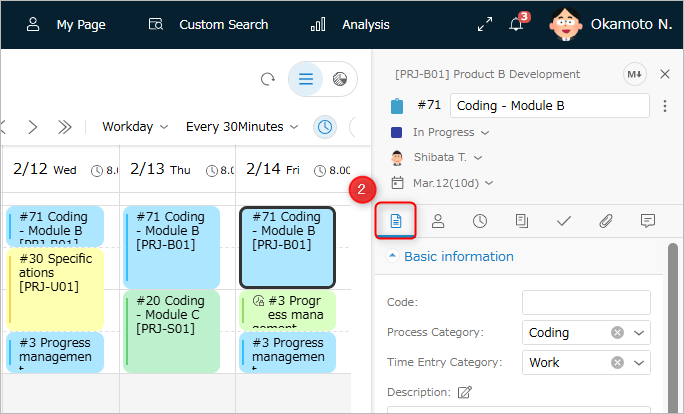
Select the work item whose item properties you want to display.
-
Click the "Fields" tab ② in the item properties.
-
Update the value in the "Progress Rate" field.
-
Click the "Save" button.
You can update the progress rate not only from the timesheet but also from the item properties on My Page.
Choosing how to determine the progress rate
In addition to directly entering the progress rate, various methods for managing the progress rate are available.
- You can specify the progress rate management method for each item,
This allows for flexible progress management according to the scale, difficulty, and organizational structure of the work. - For specific methods on determining the progress rate, please refer to the following link: "Automatically setting field values"
Techniques for checking progress with Gantt charts
The following information can be displayed on the Gantt chart:
Details will be explained below.
Displaying the Lightning Bolt Line
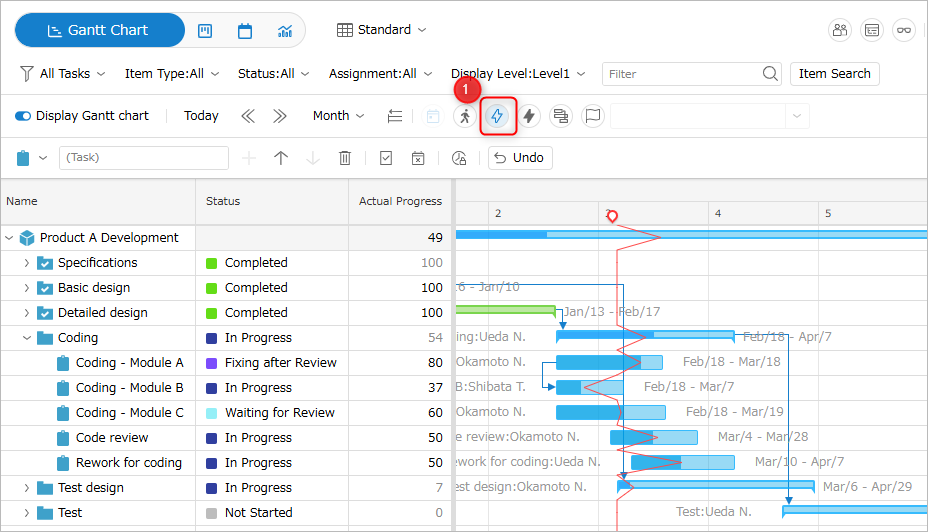
The lightning bolt line represents the delay or progress of each item relative to the plan.
You can visually check the progress of each task by its position relative to the current line on the Gantt chart.
- If it's on the left: Indicates that it's behind the plan.
- If it's on the right: Indicates that it's ahead of the plan.
To display the lightning bolt line, click the "Show Lightning Bolt Line" icon ① on the toolbar to select it.
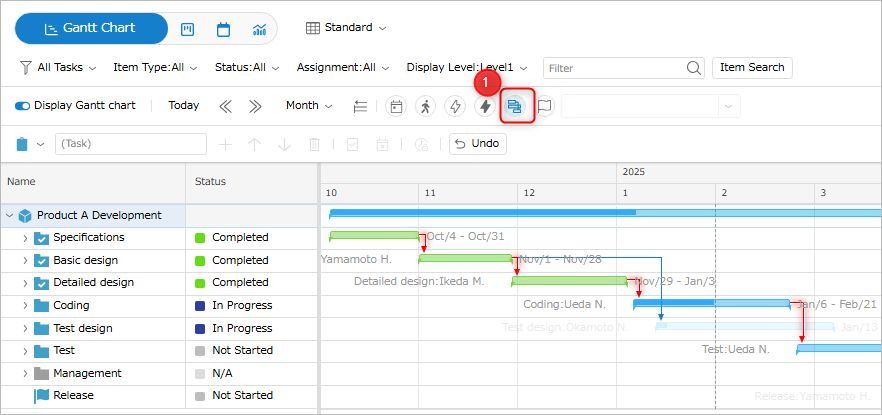
Displaying Past Lightning Bolt Lines
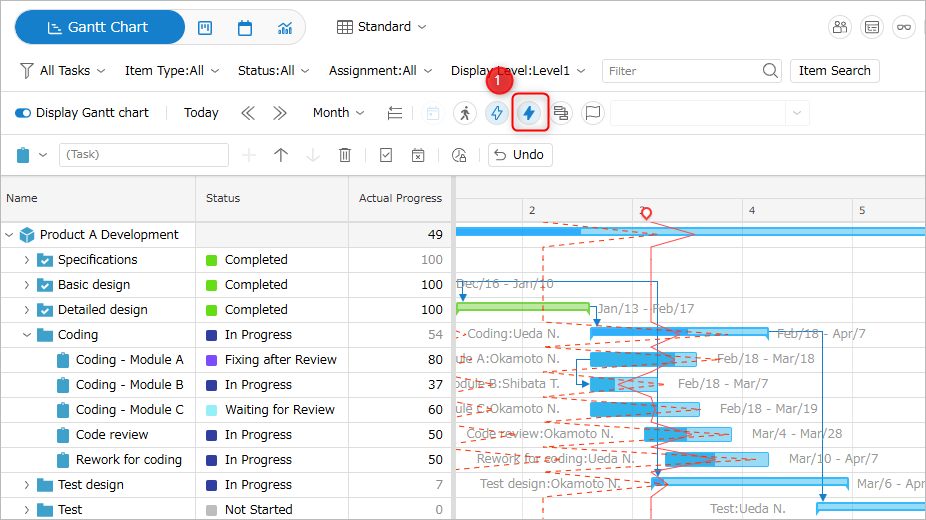
You can display past lightning bolt lines.
Multiple past lightning bolt lines are displayed, allowing you to check the progress changes by comparing them with the current lightning bolt line.
You can display them by clicking the "Show Past Lightning Bolt Lines" icon ① on the toolbar.
Note that the range for displaying past lightning bolt lines varies depending on the Gantt chart display unit, as shown below.
| No. | Gantt Chart Display Unit | Lightning Bolt Line Display Range |
|---|---|---|
| 1 | Day | Past 4 Weeks |
| 2 | Week | Past 4 Weeks |
| 3 | Month | Past 4 Months |
Manual saving is not required.
Calculation Formula for Representing Lightning Bolt Lines
Lightning bolt lines indicate where in the planned period the current progress rate should be achieved.
Therefore, the interval from today to the display of the lightning bolt line will be the number of days that have been delayed or advanced.
The specific date indicated by the lightning bolt line is determined by the SPI, an earned value indicator, using the following formula:
| SPI Value | Progress Status | Lightning Bolt Line Date |
|---|---|---|
| Less than 1 | Delayed | Start Date + (SPI × Elapsed Working Days) |
| 1 | On Plan | Start Date + (SPI × Elapsed Working Days) |
| Greater than 1 | On Track | Today +{(Actual Progress Rate - Planned Progress Rate)/(100 - Planned Progress Rate) ×(Working Days from Today to End Date)} |
Saving and Displaying Baselines
A baseline is a record of project information at a past point in time, serving as historical planning information.
You can compare the saved baseline with the current plan and view the differences on the Gantt chart.

From here, we will introduce how to save, display, and edit baselines.
Saving Baselines
-
Open the target project.
-
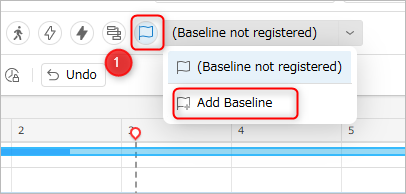
Click the "Show Baseline" icon ① on the toolbar.
-
Select "Add Baseline".
-
Specify the following items and click the "OK" button.
- Baseline Name
- Baseline Date

- Baseline Name
This is the information last updated on the date specified in "Baseline Date".
If the plan is changed again on the day the baseline was saved, it will be saved with the last changed plan.
Displaying Baselines
-
Open the target project.
-
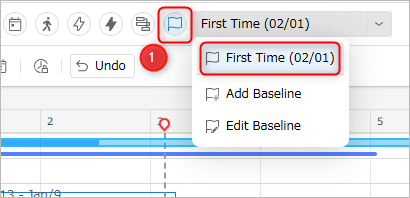
Click the "Show Baseline" icon ① on the toolbar.
-
Select the baseline to display.
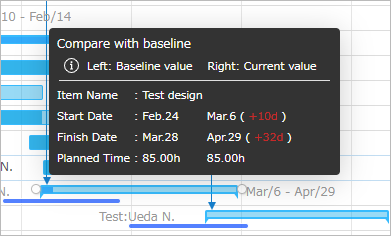
When you move the cursor to the target work item in the Gantt chart, the difference from the baseline will be displayed in a pop-up window.
You can check the postponed period and increased effort.
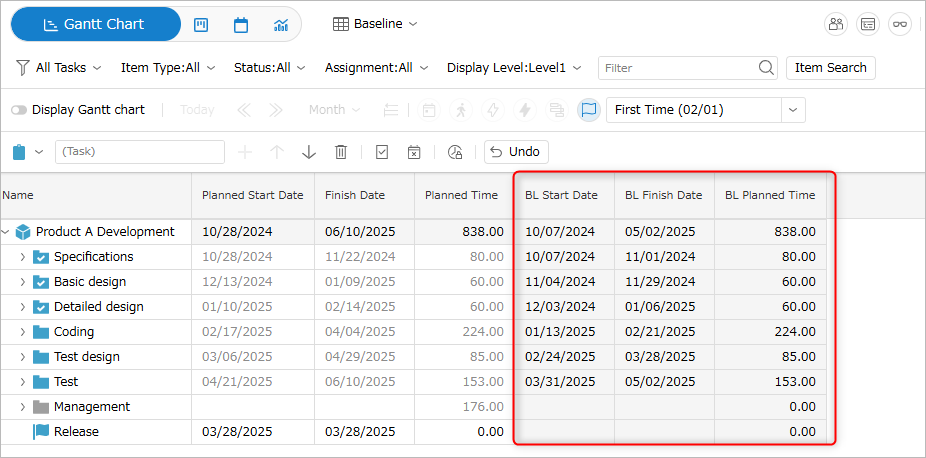
Displaying baselines adds the following columns to the Gantt table, making it easier to compare with the current plan.
- BL Start Date
- BL End Date
- BL Planned Effort
Deleting and Editing Baselines
- Open the target project.
- Click the "Show Baselines" icon ① on the toolbar.
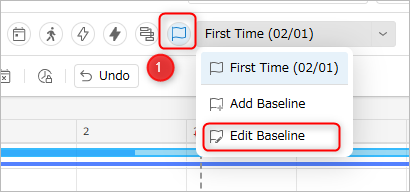
- Select "Edit Baseline".
- Select the target baseline and click "Edit" or "Delete".
The following can be changed by editing.
- Baseline Name
- Baseline Date

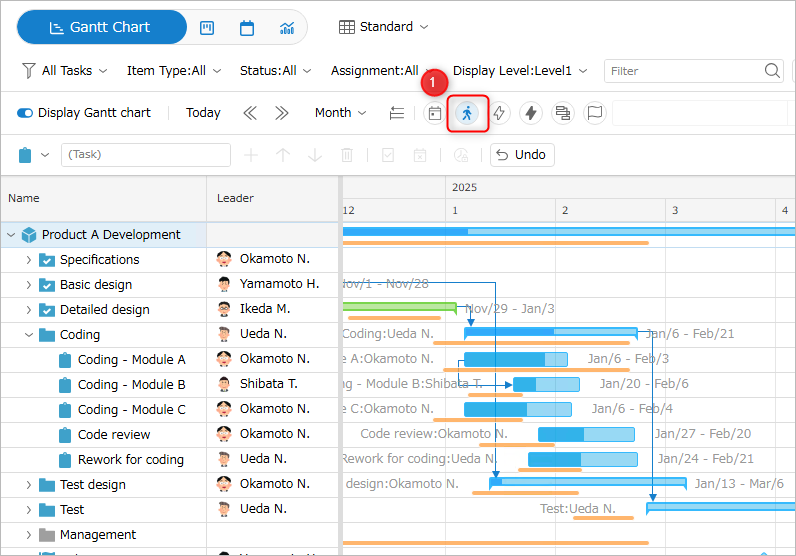
Displaying the Actual Line
The actual line represents the period during which actual man-hours have been entered.
By displaying and comparing the Gantt bar for the planned period and the actual line on the Gantt chart,
you can verify whether the work is being carried out according to the plan.
You can display it by clicking the "Show Actual Line" icon ① on the toolbar.
Displaying the Critical Path
The critical path is a path that shows a series of work items whose delays directly lead to project delays.
By displaying the critical path, you can easily check important work items in progress management.
Work items included in the critical path are highlighted on the Gantt chart.
You can display them by clicking the "Show Critical Path" icon ① on the toolbar.
If the WBS is hidden due to the application of filters or collapse, it may not be highlighted.
To display the critical path, it is recommended to remove filters and expand the entire WBS.
How to Manage Progress
TimeTracker RX allows you to manage progress in the following ways:
Managing with Status
You can define the state of a work item until completion in stages as a "status".
- Because you can objectively define the progress,
You can manage the progress more simply and explicitly. - Because the stages of progress are simpler than progress rates, progress management can be easily managed.
Since status and progress rates can be associated, it also supports management linked to progress rates.
Setting a Status for a Work Item
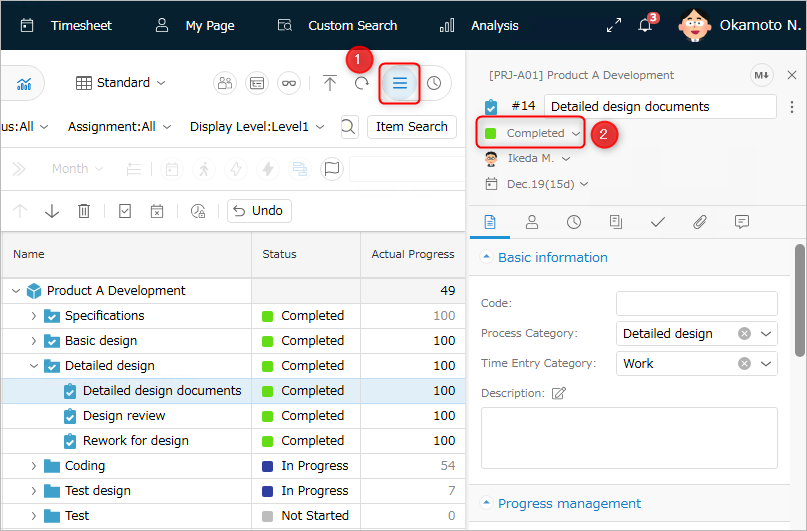
- Open the target project.
- Select the target work item.
- Click the "Item Properties" icon ① in the local navigation.
- Click "Status" ② and select the appropriate status from the list.
Associating Progress Rates with Statuses
- Open the target project.
- Click "Settings" in the local navigation.
- Select Status ① from the left-hand side menu.
* Statuses are defined for each item type. - Set the corresponding progress rate for the displayed status.
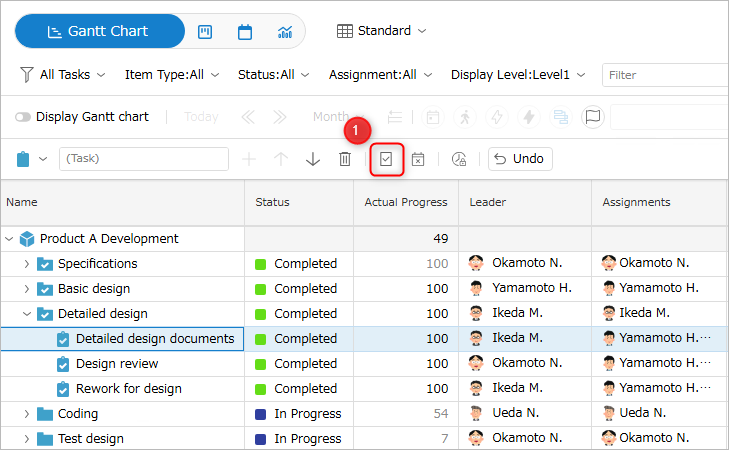
Setting Work Items to Complete
Regardless of the progress rate or status, the status of a work item (completed, incomplete) can be easily switched.
The progress rate and status values are updated in conjunction with the completed/incomplete status as follows:
- Setting the status to "Completed" sets the progress rate of that work item to 100%.
- Changing from "Completed" to "Incomplete" updates the progress rate of that work item to 0%.
Right-click the target work item and select "Mark as Complete" under "Completed/Incomplete" in the menu that appears.
Managing with Check Items
Check items allow you to define and manage detailed tasks within a work item.
The information of set and updated check items is immediately reflected in the project management screen and can be used as follows:
- Management of detailed tasks (To-Do list) for each work item
- Item progress management
The progress rate of work items is updated according to the percentage of completed check items.
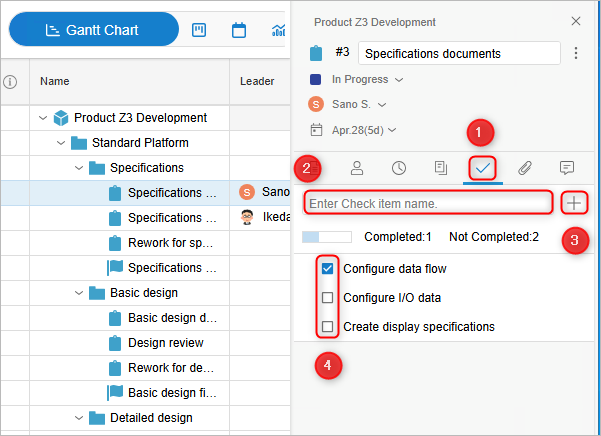
Check item operations are performed in the "Check Items" tab① of "Item Properties".
Registering Check Items
You can register check items using the following method to make them items in checklists and to-do lists.
- Enter the name of the check item in the item name input field ②.
- Click Enter or the "+" button ③.
- Click the "Save" button.
Marking Check Items as Complete
To mark a check item as complete, indicate that the item has been completed.
To mark an item as complete, check the checkbox ④ in front of the check item.
Deleting Check Items
You can delete unnecessary check items using the following method.
- Right-click the target check item.
- Select "Delete" from the displayed menu.
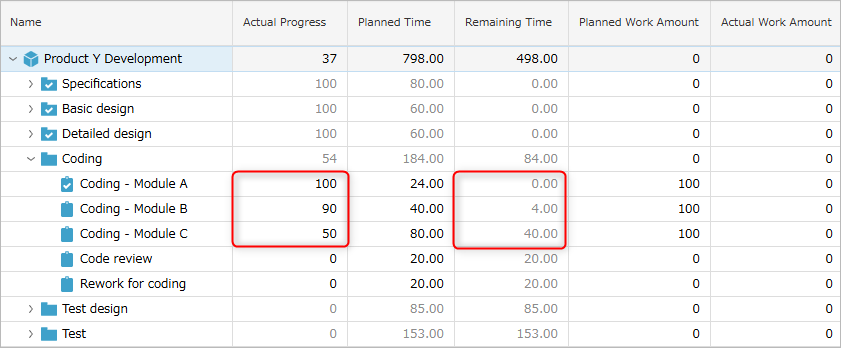
Managing with Remaining Work Time
The progress rate is calculated and displayed from the planned effort and remaining work time.
The remaining work time is set to indicate how much longer it will take to complete the task.
- Before starting the task, set the remaining work time to the same value as the planned effort.
- By decreasing the remaining work time as the task progresses, the progress rate increases.
- Remaining work time can also be set from the timesheet.
For calculation methods, please refer to the following link: "Automatically Set Field Values"
Please set it using the following method:
- Open the target project.
- Right-click on the "Progress Rate" of the target work item.
- Select "Progress Rate (Remaining Work Time)" from the "Determination Method" list.
- Set the "Remaining Work Time" of the target work item to the same value as the planned effort.
In the image below, the remaining work time is initially set to the same value as the planned effort.

As the work progresses, the progress rate increases as the remaining work time decreases.
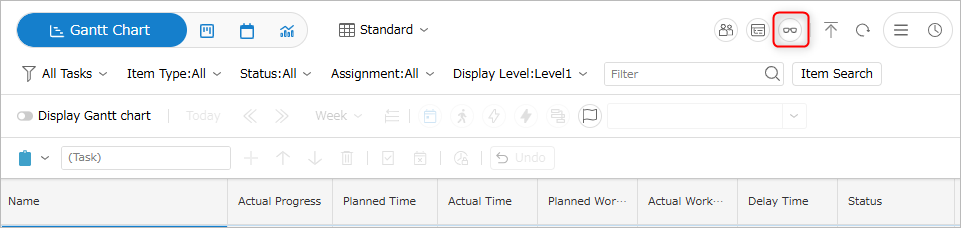
Managing with QuickWatch
QuickWatch is a convenient function that allows you to view tasks within a project in a list format tailored to your purpose.
- Tasks can be sorted and displayed in order of greatest delay or closest due date, allowing you to check for any problems and prioritize tasks.
- Project status, which was difficult to see with the tree structure (WBS) alone, can now be easily checked. Example: Which tasks are high-risk?
You can open the screen by clicking "Quick Watch" in the local navigation.
Examples of Quick Watch Usage
In the example below, tasks are displayed in descending order of the number of days behind.
The greater the delay, the higher the priority of the work item, allowing you to proceed with the work.
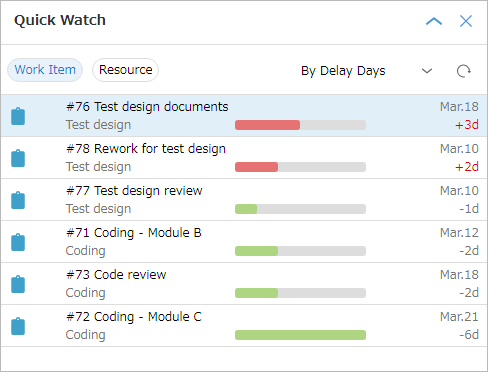
-
Clicking a work item name selects that work item on the project's WBS.
-
The display order of work items can be used in the following ways:
- By delay days: Determine the priority of tasks, such as addressing items with the biggest delays first.
- By due date: Determine when and which items should be done.
- By creation date: View a list of recently added items.
- By update date: View a list of items whose information has been recently updated.
-
You can also check progress delays on a leader-by-leader basis by clicking the "Resource Watch" icon.
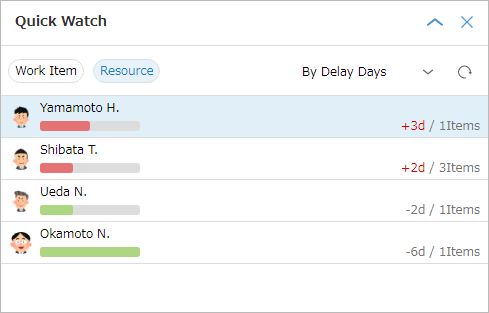
- The delay days display the most delayed work item among those you are responsible for.
- Clicking on a resource name will display the resource load screen.
- The delay days display the most delayed work item among those you are responsible for.