How to set up
Create a pivot view
By setting the data to be aggregated and the aggregation conditions in the view,
manpower, cost, etc. can be aggregated and displayed in a table format.
- You can freely change the target data and aggregation axis of the created view later.
- You can register multiple views and easily switch between them at any time.
The target of the pivot view varies depending on the following three output tables.
Please refer to the following link for notes on each table. : "Notes"
| Table name | Aggregation target | Aggregation unit | Specify period[^1] | Custom field | Recommended usage |
|---|---|---|---|---|---|
| Efforts and costs | Results linked to users | Item | Yes | Target[^2] | Single project analysis[^3] |
| Folder | Yes | Not applicable | Cross-project analysis | ||
| All items | Item data | Item | Not applicable | Target | Single project analysis[^3] |
[^1] Aggregates the trends within the period specified by the start date and end date.
[^2] Displays the value set for the target item.
(This is not the value for the specified period. For details, see the following link: "Notes on custom field aggregation")
[^3] You can specify the aggregation target by following the steps in the following link: "Setting analysis function limits"
Please set according to the specifications of your server PC.
If you use "Man-hours and costs (per item)" or "All items", system administrators should set the upper limit of the analysis target according to the specifications of the server PC.
For the setting method, see the following link: "Setting analysis function limits"
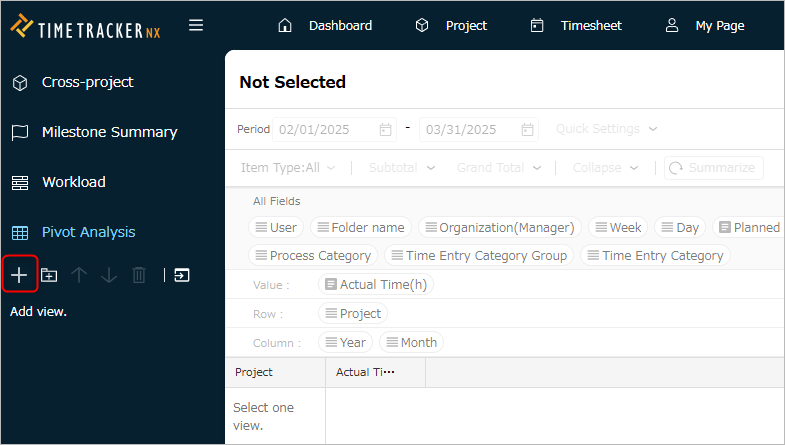
The steps for creating a pivot view are shown below.
-
Click the "Add View" icon on the toolbar on the left side of the screen.
-
Set the following in the "Create Pivot View - Basic Information" dialog.
- Name: Name of the view
- Output Table: Select the target table
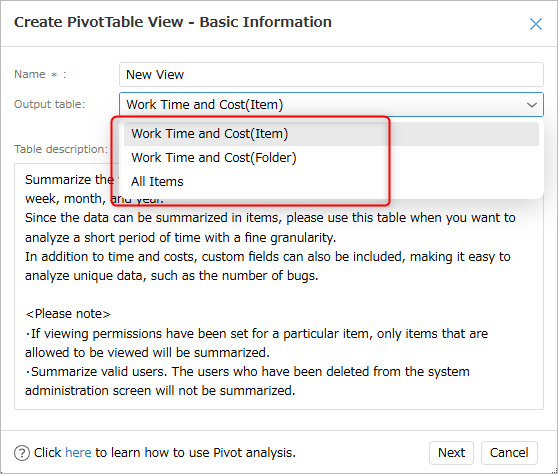 The type of pivot output table cannot be changed once it has been created.
If you want to change the table type, create a new output table.
- Name: Name of the view
-
In the "Create Pivot View - Target Data" dialog, select the type of target data to be aggregated from
"Filter Target" and add it.
The selection will vary depending on the contents of "Output Table" as follows:-
For "Effort and Cost": The target will change depending on the type of analysis table (item/folder).
Filter Analysis target Item Folder User Specified user ○ ○ Organization User belonging to specified organization ○ ○ Project User assigned to specified project ○ Project folder User assigned to item under specified folder ○ -
For "All items"
Filter Analysis target Administrator Project where specified user is administrator Organization (Administrator) Project where project administrator belongs to specified organization Organization (Project) Project belonging to specified organization Project Specified project Target for aggregation when "All items" is selected- If "Only active projects" is checked, completed projects will not be included in the aggregation.
- The maximum number of projects to be aggregated is the value set in the system settings.
- See the following link for how to set it: "Setting analysis function limits"
- For details, please contact your system administrator.
- See the following link for how to set it: "Setting analysis function limits"
- If "Only active projects" is checked, completed projects will not be included in the aggregation.
-
-
Check the fields to be used in the "Create Pivot View - Display Fields" dialog.
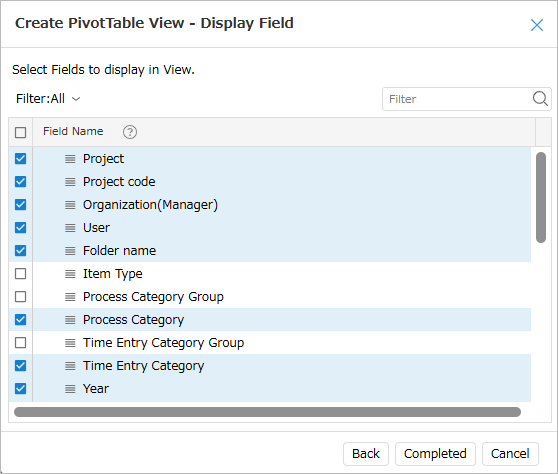 The target to be specified varies depending on the field, such as matrix or value.
See the following link for available fields: "Available Fields"
-
Click the "Finish" button.
The pivot analysis screen will be displayed.
The following is the screen when "Effort and Cost (by Folder)" is output.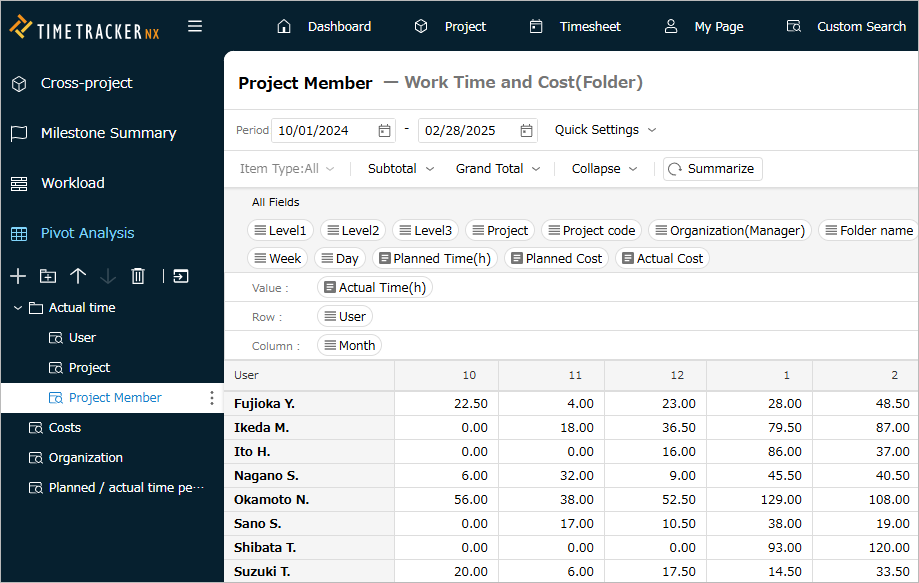 Output table: For "All Items", the latest status of the selected projects will be aggregated regardless of the period.
Change the Pivot View Settings
You can change the target data for which effort and cost are aggregated later.
The following are the common settings for the Pivot Analysis View.
The following explains the various buttons that operate the Pivot View.
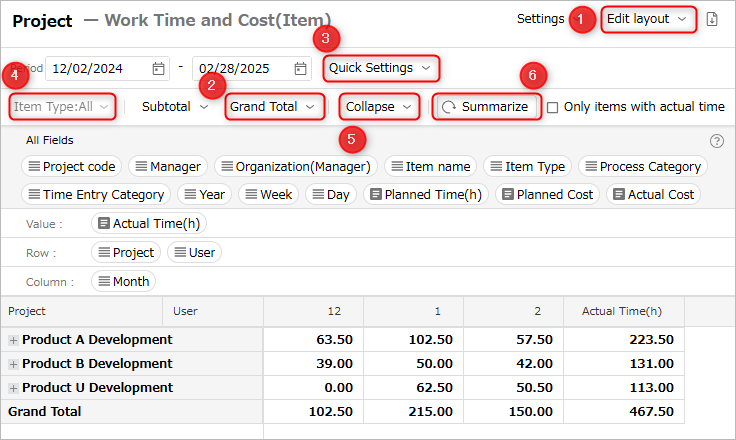
The following explains the various buttons in the order of the numbers in the figure above.
For the operation procedure, please refer to the following link: "Export/Import View Settings" (#import_export)
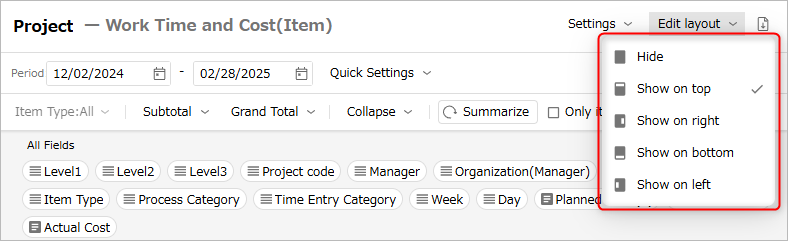
Layout
You can change the display position of the area where you set the fields to be used.
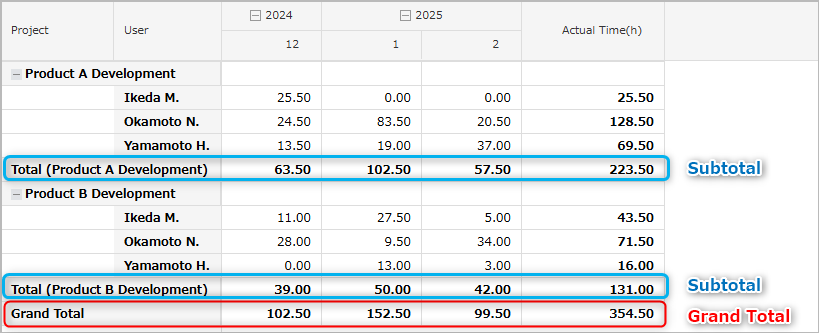
Displaying total values for columns and rows
You can display subtotals and grand totals for each field set in rows and columns.
In the example below, it is as follows.
- Subtotal: Total for each project
- Grand total: Overall total
-
Procedure for displaying subtotals
Click "Subtotal" and select the display position from the list.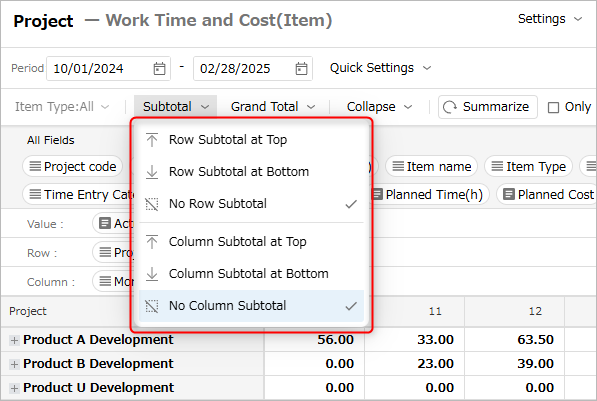
-
Procedure for displaying totals
Click "Totals" and select the display position from the list.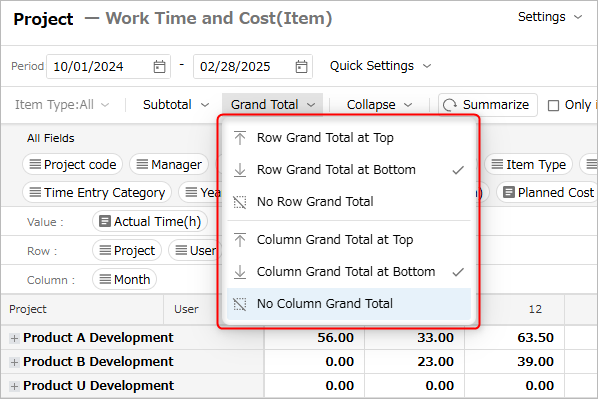
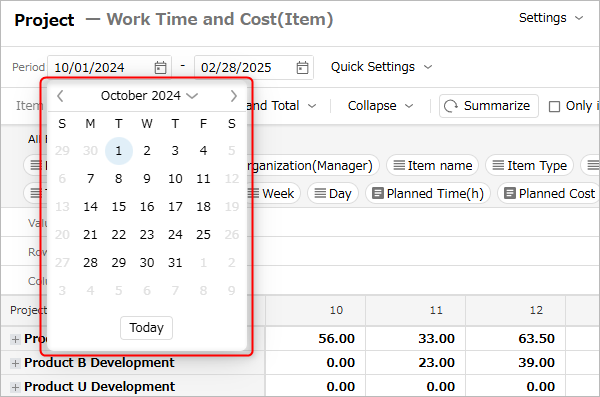
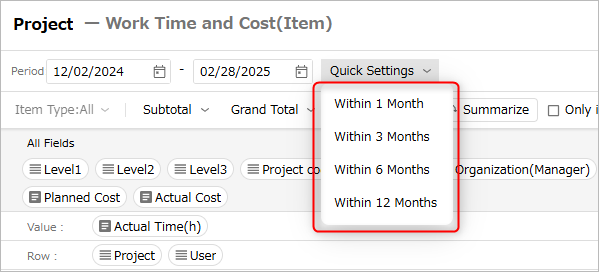
Aggregation period
You can narrow down the period of data to be aggregated by changing the "Period" date.
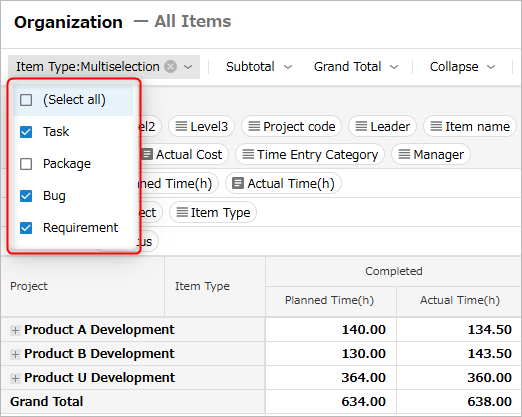
Item type filter
When you use item type as the aggregation axis, you can display analysis results limited to the specified item type.
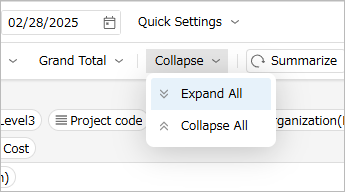
Expanding aggregation results
Collapsed rows and columns can be expanded all at once by clicking "Expand all".
- Changing the row or column field will cause it to become collapsed, so you can easily expand it with this operation.
- Clicking "Collapse all" will collapse all expanded states.
Update the display contents
When you change the layout or the aggregation axis, you need to re-aggregate the data, but you can change the method of re-aggregation.

The difference in behavior depending on whether each check box is checked is as follows.
-
Aggregate automatically when the layout is changed
Aggregates data automatically when the layout is changed.
If you do not check this box, click the "Aggregate" button when you want to aggregate.Can be used in the output table of "Effort and Cost". -
Expand all when aggregated
Expands all grids in the view when aggregating data.
If you do not check this box, click ② "Expand all" after aggregating.
Change the settings
Data to be aggregated
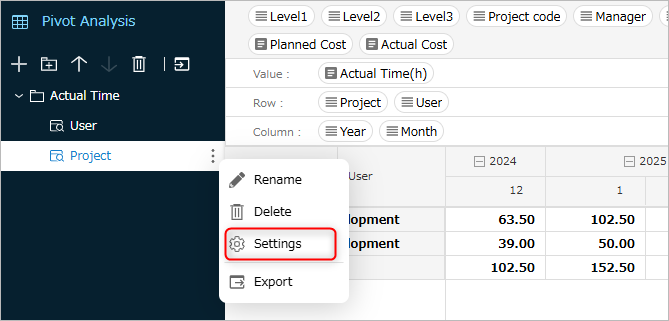
You can change the data to be aggregated later by following the steps below.
-
Click the icon to the right of the target view name displayed in the toolbar on the left side of the screen and select "Settings".
-
Select the "Target Data" tab in the "Pivot View Settings" dialog.
-
To change the filter target, select the "Filter Target" list.
For a list of available options, see the following link: "Create a Pivot View" -
To add, click the "Add" icon (+).
To delete, select the target to delete and click the "Delete" icon (-).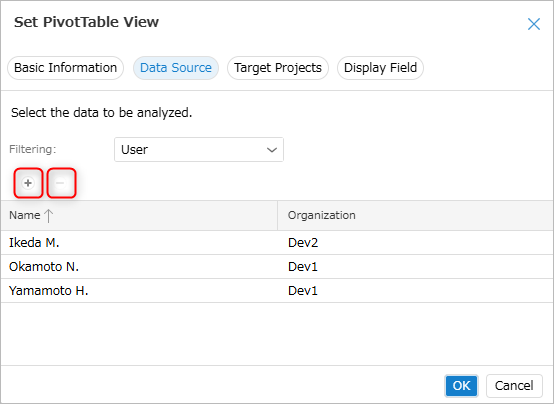
Fields used for aggregation
You can add fields to be used in the pivot view. The steps are as follows.
-
Follow steps 1 and 2 in the following link to display the "Pivot View Settings" dialog. : "Change the data to be aggregated"
-
Select the "Display Fields" tab in the "Pivot View Settings" dialog.
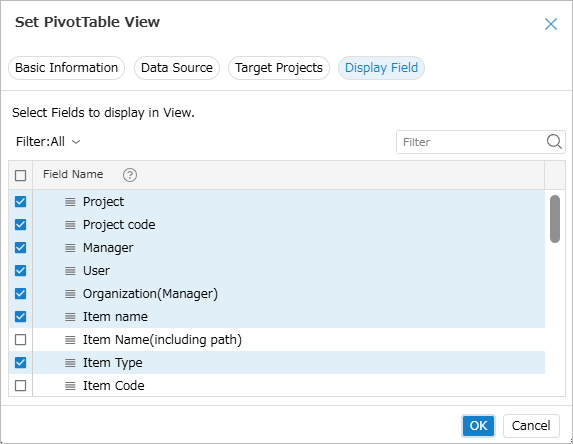
-
Check the fields to be used in the view.
Please refer to the following link for available fields. ÅF "Available fields"
Aggregation axis
Set fields to rows and columns
-
To change the aggregation axis of the created view
Drag and drop the target field set in "All fields" to "Rows" and "Columns". -
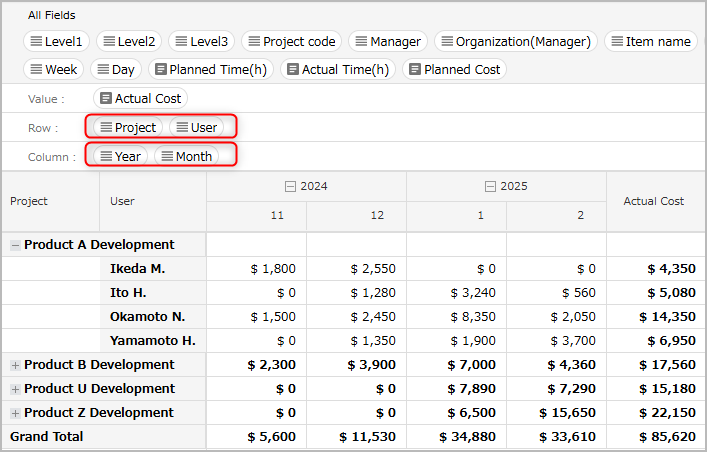
You can create a hierarchy by specifying multiple fields in rows and columns.
To aggregate the actual costs of users belonging to a project by year/month, set it as follows.
Set aggregate data
To change the aggregate field of the created view, drag and drop the target field from the fields displayed in "All fields"
to "Value".
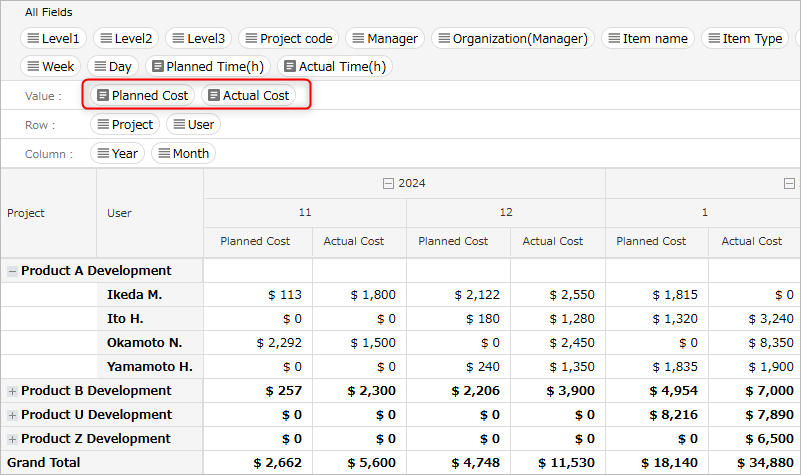
By setting multiple fields in the value field, you can display multiple aggregated data side by side.
To aggregate planned costs and actual costs, set it as follows.
Grouping pivot views
Adding groups
You can make it easier to find the views you want to use by grouping them by business content, etc.
-
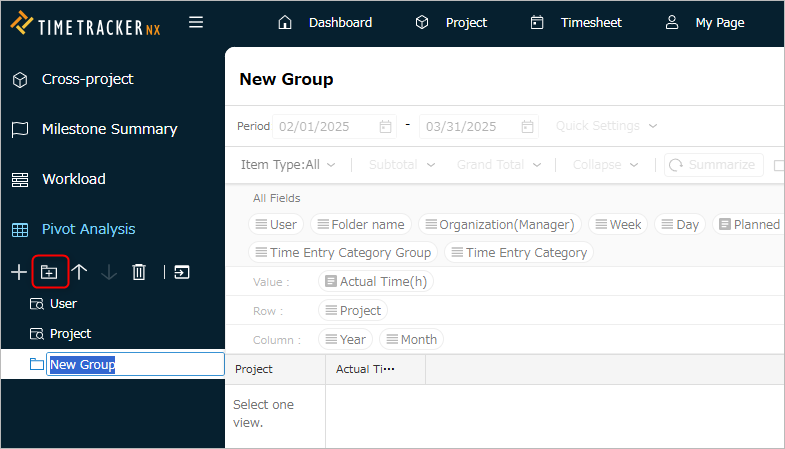
Click the "Add group" icon on the toolbar on the left side of the screen.
-
Enter a new name for the added group.
-
Drag and drop the target view into the group.
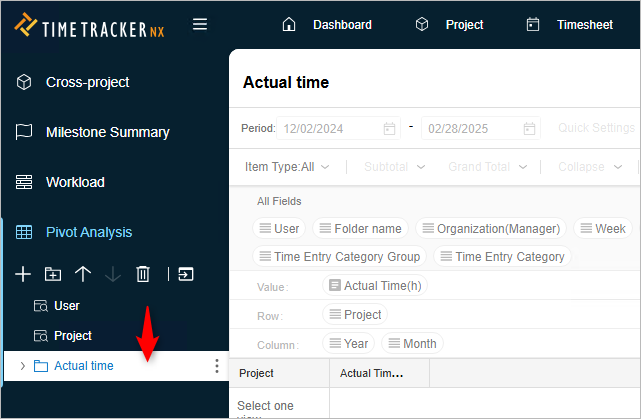
You can also create a view within a group by selecting the group you created and clicking the "Add View" icon.
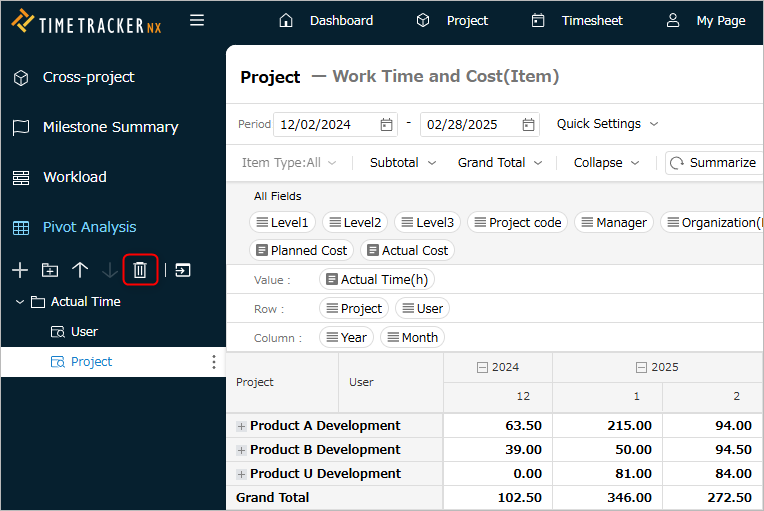
Delete a pivot view or group
You can delete groups and views that are no longer needed. The steps to delete are as follows.
-
Select the target group and view.
-
Click the "Delete" icon on the toolbar on the left side of the screen.
Export/import view settings
The view settings information set in "Create a pivot view" and "Change the settings of a pivot view" can be exported as a setting file.
Other users can import this setting file to view the aggregated results in the same view.
Export
-
Select the target view.
-
Click the "Menu" icon ① on the title bar.
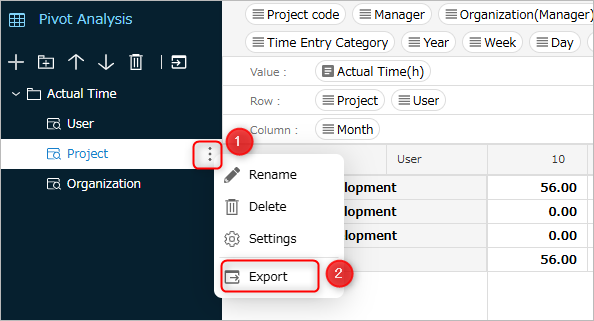
-
Select "Export" ②.
-
In the "Save As" dialog, specify the folder and file name to save the export file.
-
Click the "Save" button.
A file with the extension "analytics_pivot_view" will be created in the specified save destination.
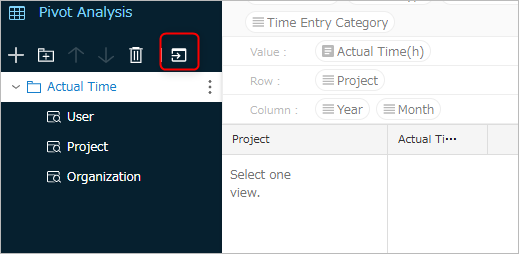
Import
-
Click the "Import" icon in the local navigation.
-
Click "Choose File" in the "Import" dialog.
-
In the "Open" dialog, select the file to import (extension: analytics_pivot_view) and click "Open".
-
Click the "OK" button in the "Import" dialog.
The imported view will be added to the end of the pivot view tree.