Points to note
Overview
Here are some points to note when using pivot analysis.
Points to note common to all tables
- Values entered in end items are aggregated.
Values entered directly in intermediate items are not reflected. - Pivot analysis tables are grouped by column name, so if there are items with the same name,
they will be aggregated together as one.
Points to note about "Efforts and Costs"
Here are some points to note when selecting "Efforts and Costs" for the output table and aggregating.
About what is aggregated
The pivot analysis of "Effort and Cost" aggregates the following work items by user.
- Resources are assigned.
- A period is set.
- A value is set in the field to be aggregated.
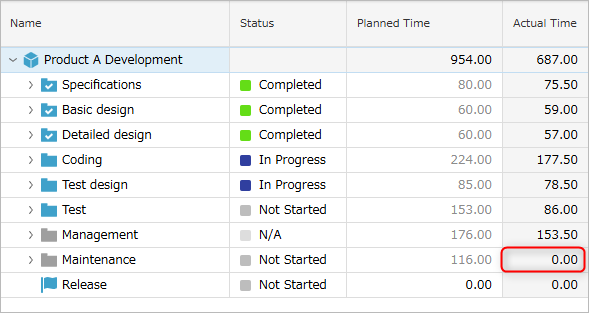
As an example, the pivot analysis results corresponding to the work item screen are shown below.
-
Work item screen configuration
-
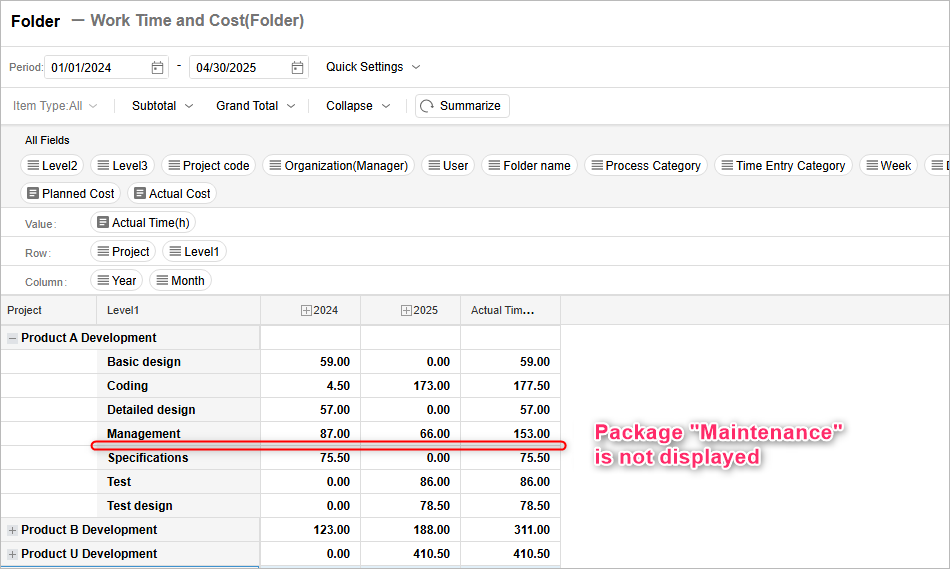
Pivot analysis results
- Only folders can be specified as "rows", and task-level analysis results are not displayed.
- Packages with actual effort of 0h ("Maintenance") are not displayed.
Analysis with "Folder" Specified
You can specify a "folder" for the pivot analysis row.
It is displayed flatly regardless of the package hierarchy, so it can be used when you want to analyze the results of folders in a parent-child relationship
without duplication.
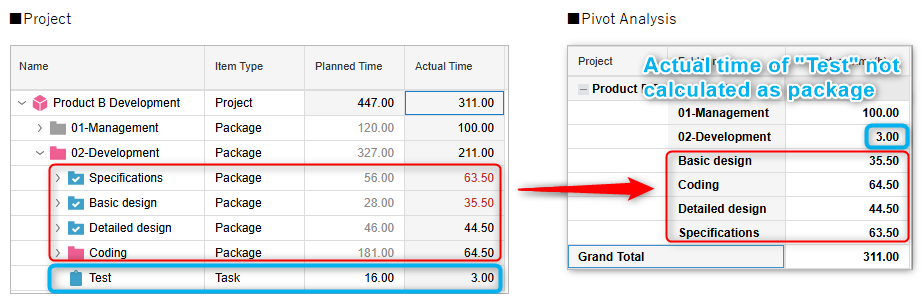
If packages and tasks are mixed at the same hierarchy within a package as shown in the figure below,
The pivot analysis screen will aggregate as follows.
-
The following are arranged flatly.
- "01-Development" package that aggregates the man-hours of a task (014-Test)
- Child packages of "01-Development" (such as 011-A Function)
- "01-Development" package that aggregates the man-hours of a task (014-Test)
-
The actual times aggregated in the "01-Development" package are only aggregated for the tasks directly under it (014-Test).
Points to note when aggregating custom fields
If the output table is "Man-hours and Cost (by item)", custom fields can also be aggregated.
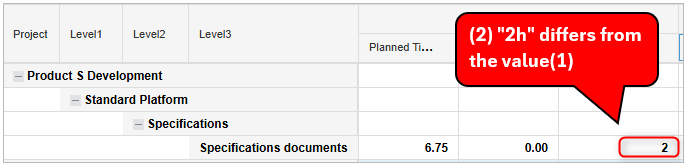
However, unlike planned times/actual times, it displays the custom field values entered for the corresponding items.
Therefore, the aggregated results of integer-type custom fields in "Man-hours and Cost (by item)"
may not match the values in the Gantt chart.
Example) When multiple resources are assigned to one item, the values will differ as shown in ① and ② in the figure below.
| Gantt table values | Pivot analysis values |
|---|---|
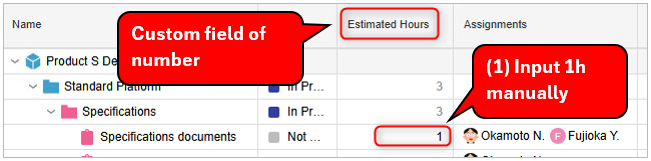 |  |
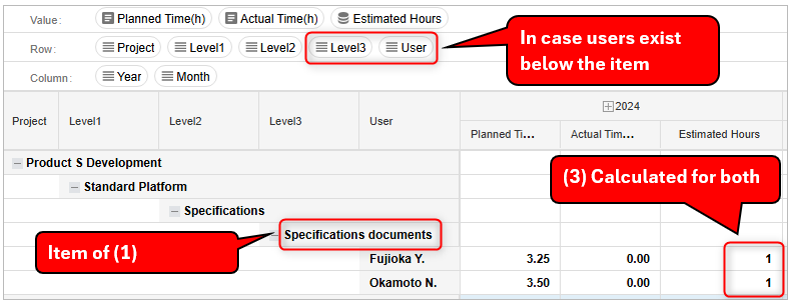
This is because the ``custom field values of items with planned/actual times'' are aggregated by resource.
Points to note when aggregating process and work categories
The process and work categories used to aggregate are different for planned and actual times.
- Planned times: The process and work categories set in the work item (= the initial value when man-hours are entered)
- Actual times: The process and work categories set in the actual times
Points to note about "All items"
Here are some points to note when selecting "All items" in the output table to aggregate.
Security permissions for items to be aggregated
Since the aggregation is based on item information, items that you do not have permission to view will not be aggregated.
Please check your security permissions when aggregating.
For security permissions, see the following link. : Set item-level security
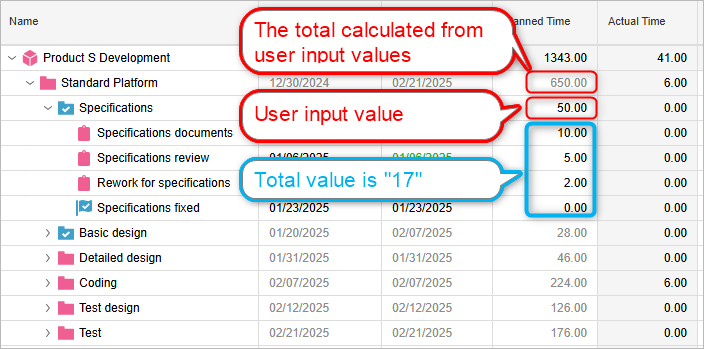
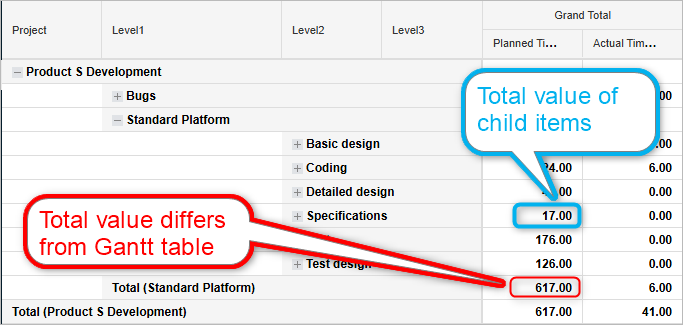
Aggregation when item values are directly overwritten
The pivot analysis function aggregates the values of end items, so if an intermediate item is set to "user input", the aggregated value of pivot analysis may differ from the value in the Gantt table.
| Gantt Chart Screen | Pivot Analysis Screen |
|---|---|
 |  |
Points to note when aggregating process and work classifications
For both planned and actual times, the process and work classifications that are the source of aggregation are the "process and work classification values set in the work item (= initial values when man-hours are entered)."
If you want to aggregate actual times using the process and work classifications set in the actual times, select "Man-hours and cost" in the output table.