Utilization techniques
Overview
TimeTracker RX provides functions to make effective use of the analysis results.
Please use it according to your environment.
Display items in a hierarchical structure
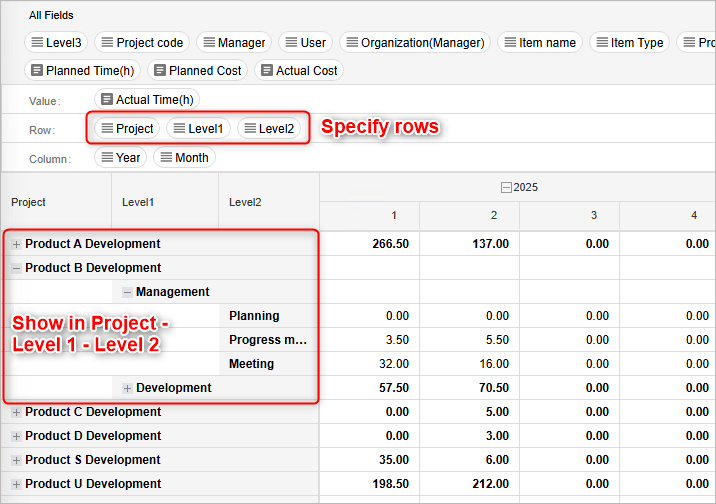
You can check the breakdown of the aggregated labor hours and costs by reproducing the hierarchical structure of items set in rows or columns.
You can express the hierarchical structure of items by using the "Hierarchy 1" to "Hierarchy 16" fields.
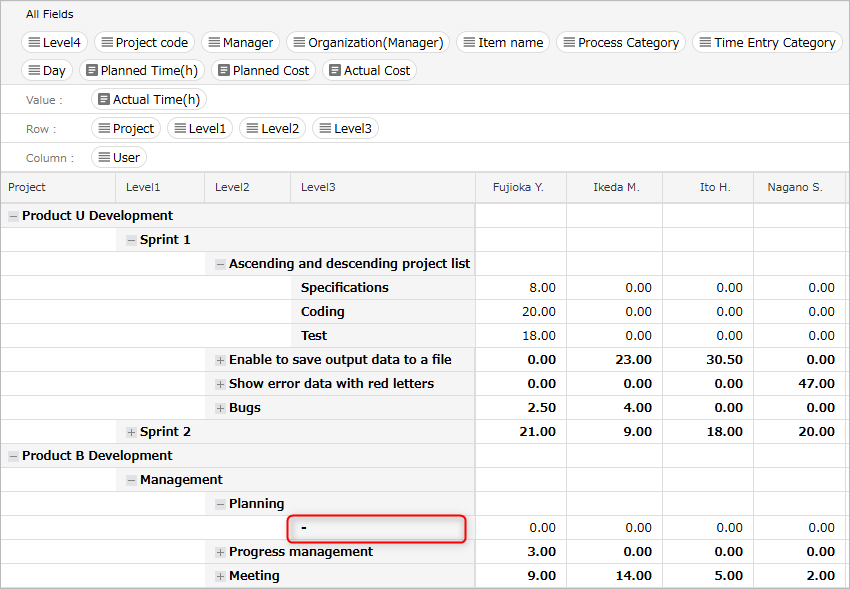
If you display a hierarchy deeper than the actual hierarchy, non-existent hierarchies will be displayed as "-".
Export the aggregated results
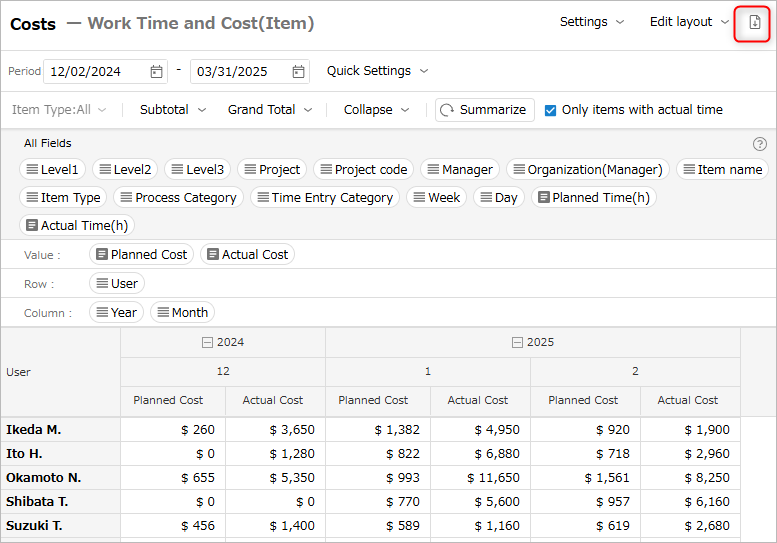
You can output the labor hours and cost information aggregated by pivot analysis to a file in Excel format.
This is useful for processing the output content to create documents or print them.
-
Display the view to be exported.
-
Click the "Export in Excel" icon.
-
Click the "Execute" button in the "Export in Excel" dialog.

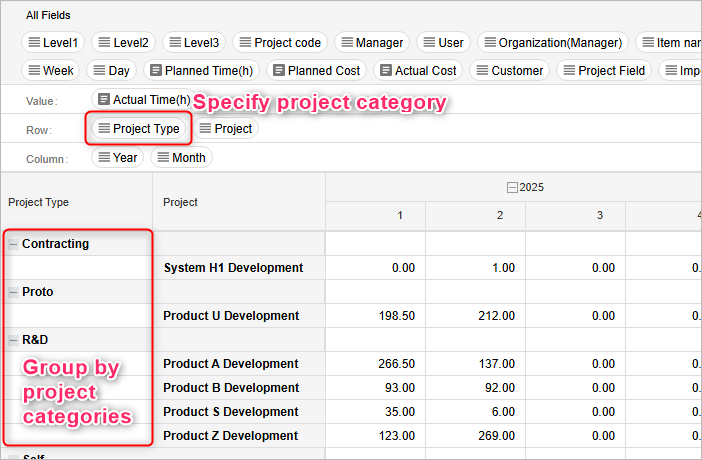
Aggregate across projects
You can classify and aggregate projects by setting project categories as the aggregation axis.
Concepts that group together multiple projects include "business field" and "customer".
By aggregating on these axes, you can easily check the situation that is not visible when looking at a single project.
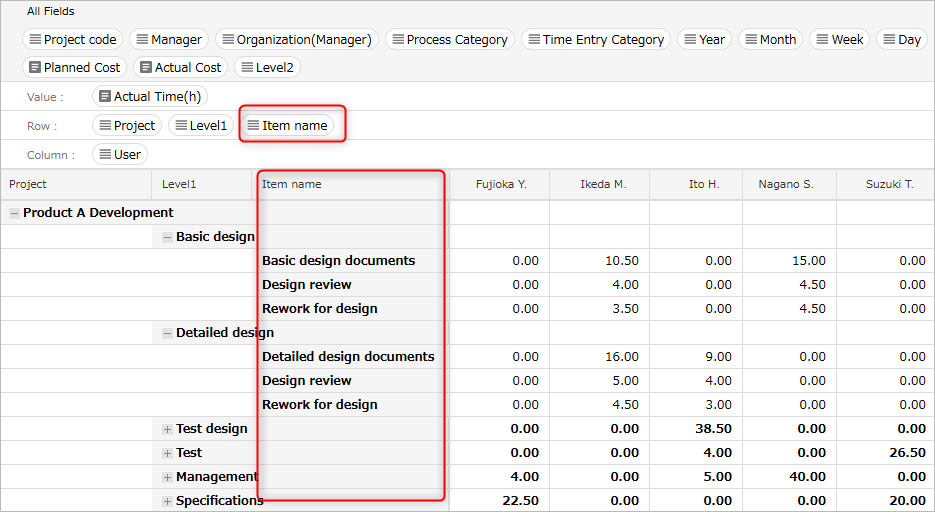
Aggregate by item
You can set the item name as the aggregation axis.
This can be used when you want to perform detailed analysis on an item-by-item basis.