Analyzing from a Unique Perspective
Overview
There are two types of "Quick Reports," which can be used according to your purpose.
- Built-in Reports
- Outputs data using pre-defined aggregation axes, such as "Projects with High Man-Hours."
- Ready to use whenever you need it.
- Custom Reports
- Allows you to set your own man-hours for aggregation and aggregate the man-hours you want to analyze.
- For example, man-hours with specific characteristics, such as "interruption work."
- Multiple reports can be created and used according to your purpose.
- Allows you to set your own man-hours for aggregation and aggregate the man-hours you want to analyze.
This section introduces how to use custom reports.
If you want to use built-in reports, please refer to the following link: "Analyzing Man-Hours"
Creating a New Report
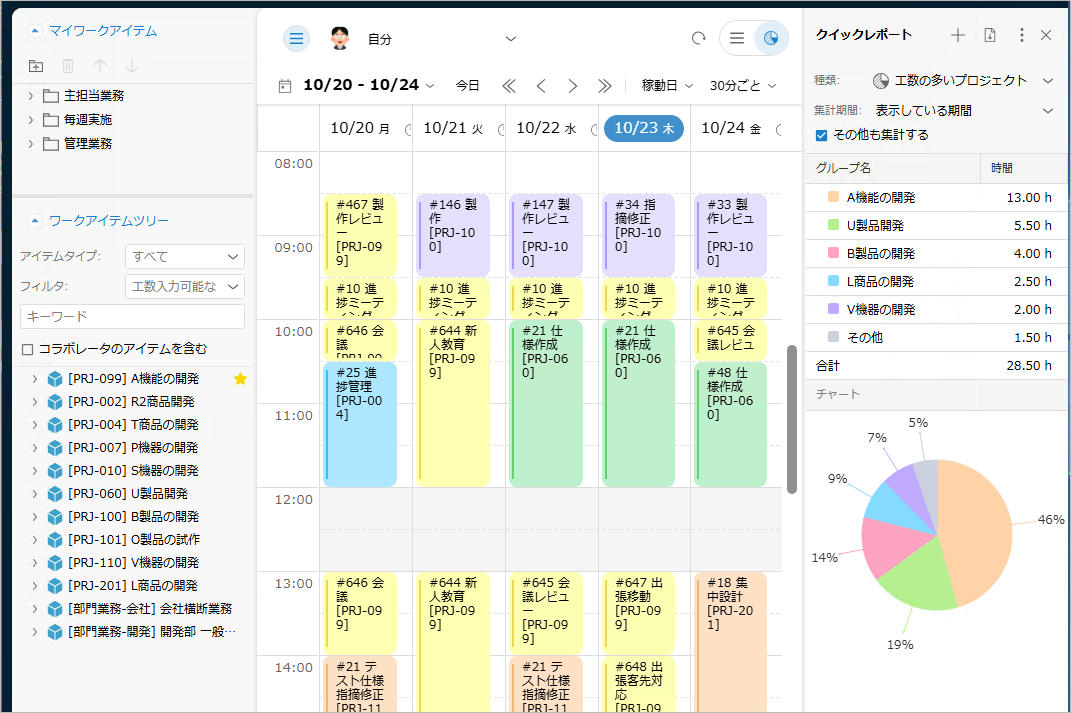
The items used to aggregate man-hours in quick reports are called "groups," and you set the conditions for the man-hours to be aggregated at the group level.
By aggregating the man-hours displayed on the timesheet by group, you can classify man-hours according to your purpose.
Custom reports primarily aggregate the following:
- Common characteristics of the project
- Work items of interest (smaller granularity than the project)
- Items with specific keywords across projects
We will introduce the steps for each.
Aggregating by 'Common characteristics of the project'
Define groups based on common characteristics of the project using the following method.
Example) "Main tasks" and "Interruption tasks," etc.
Then, register multiple projects together in a group and create a custom report.
-
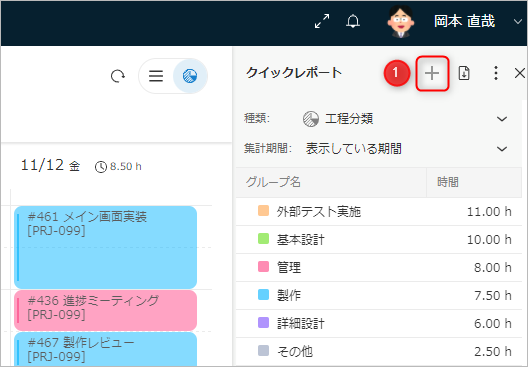
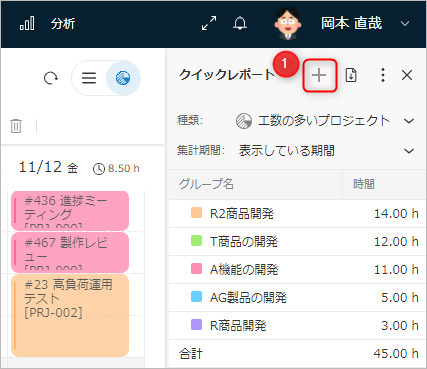
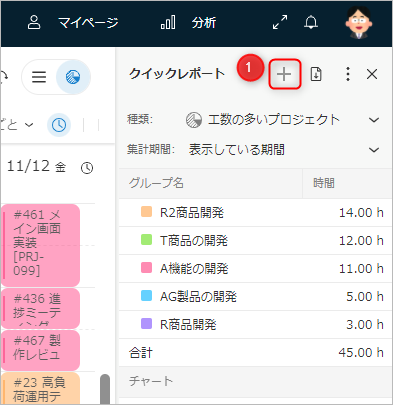
Click the "Add Custom Report" icon ①.
-
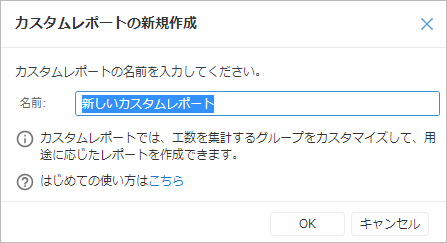
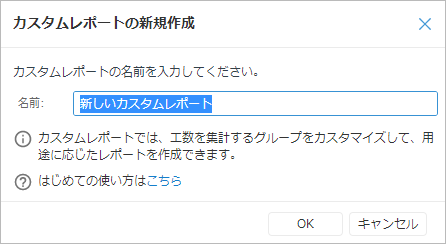
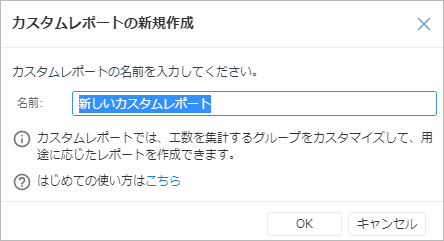
In the "Set Name" dialog, enter the name of the new report and click "OK".
-
Click the "Add Group" icon ② to add items for aggregating man-hours.
These items are called "groups" in Quick Reports.
-
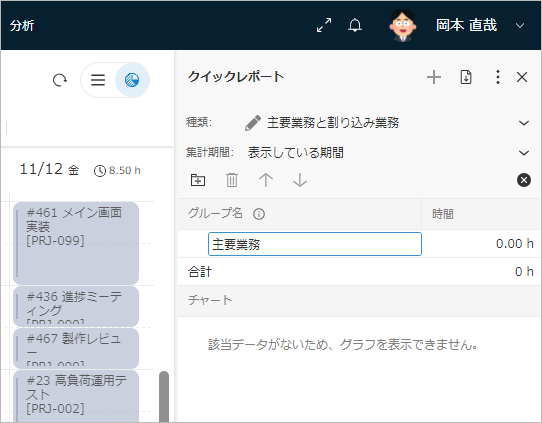
Enter a group name. (Example: "Main Tasks," etc.)
-
Repeat step 3 to add groups for each man-hour item you want to aggregate.

-
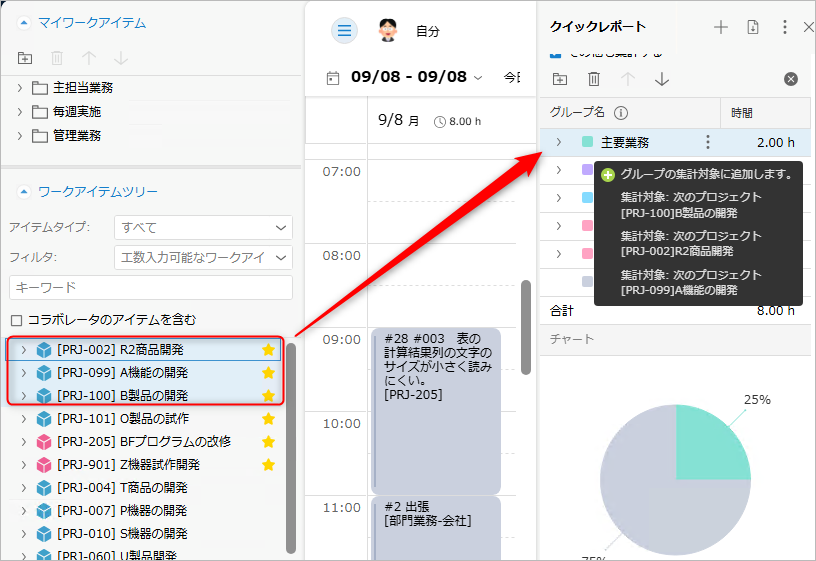
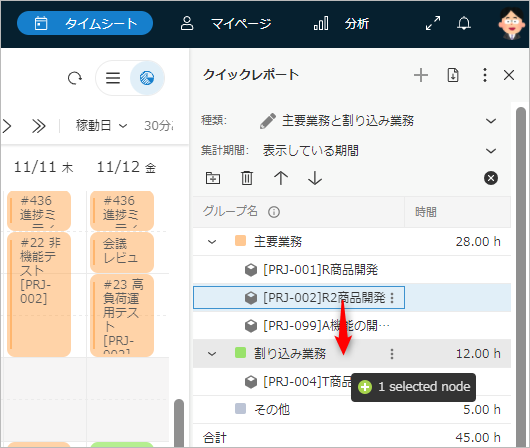
Select the projects to include in the group from the Work Item Tree and drag and drop them into the Quick Report group.
-
Repeat step 6 for each defined group to define the man-hours to be aggregated in the quick report.
-
Select the period to be aggregated from the "Aggregation Period" dropdown list.
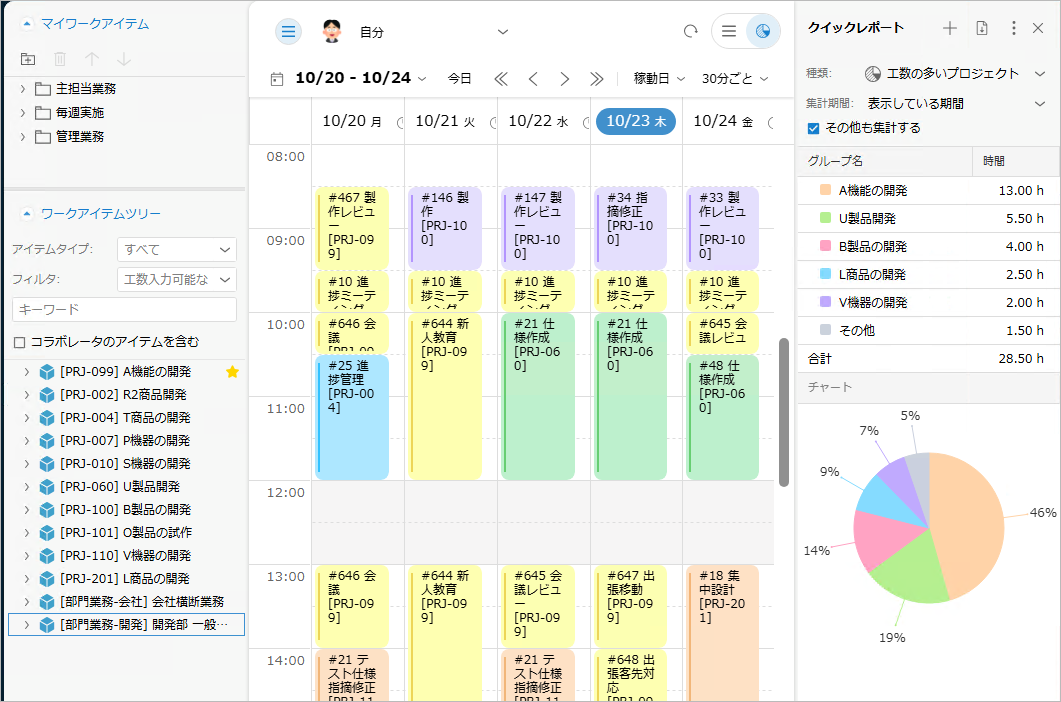
Following the above steps, the report shown in the figure below was created.
- Projects are classified by two characteristics: "Main Tasks" and "Interruption Tasks".
- You can review whether man-hours are being allocated to the tasks that should be performed.
Aggregating at a finer granularity than projects
You can also register man-hours for work items of interest at a finer granularity than projects, such as "cases" within a project, in the quick report.
Afterward, you can check the aggregation results and create a custom report.
In custom reports, only the man-hours you want to aggregate will be color-coded, allowing you to quickly check the status of the man-hours you're interested in.
-
Click the "Add Custom Report" icon ①.
-
In the "Set Name" dialog, enter a name for the new report and click "OK".
-
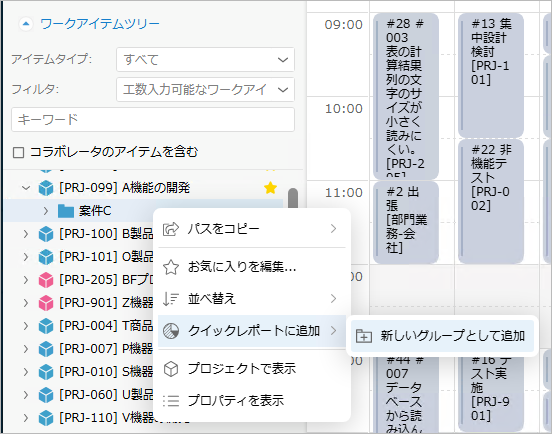
In the Work Item Tree, select the work item you want to aggregate and right-click.
-
From the menu that appears, select "Add as New Group" under "Add to Quick Report".
-
While checking the actual timesheet data, repeat step 3 for any additional work items you want to aggregate.
-
Select the period to be included in the aggregation from the "Aggregation Period" dropdown list.
Following the above steps, the report shown in the figure below was created.
- Focus on "Project A," "Project B," and "Project C."
- Check which projects are being worked on this week.
- Projects not set in the custom report are displayed in gray.
Aggregating by "Items with Specific Keywords"
Create a quick report that aggregates man-hours based on task names and notes associated with man-hours.
- For example, you can aggregate man-hours used for activities other than design and production, such as "meetings," "business trips," and "training."
- You can aggregate across projects.
-
Click the "Add Custom Report" icon ①.
-
In the "Name Settings" dialog, enter the name of the new report you want to create and click "OK".
-
Click the "Add Group" icon ② to add the items for which you want to aggregate man-hours.
These items are called "groups" in Quick Reports.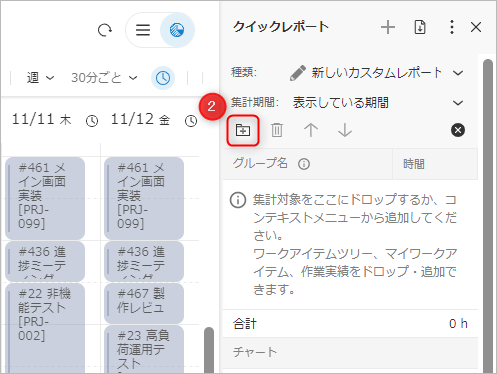
-
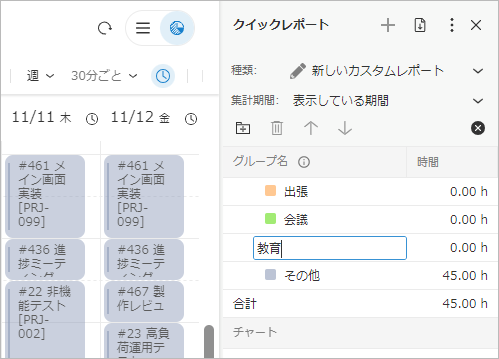
The name will be added to the "Group Name" field with an editable name. Enter the keyword you want to aggregate (for example, "Business Trip").
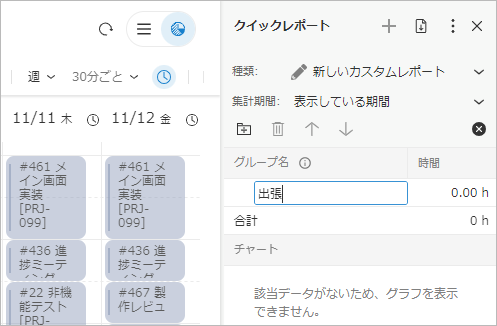
-
Repeat step 3 to add groups for each item of man-hours to be aggregated.
-
Click "Settings" ③ to the right of the group for which you want to set conditions.
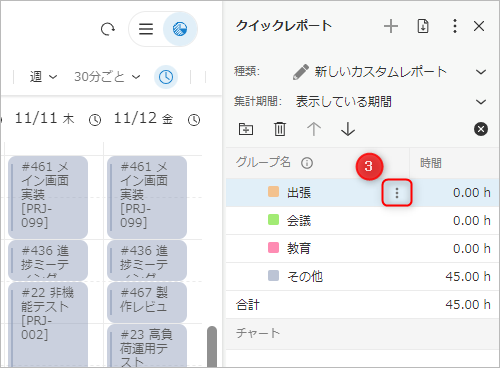
-
Click "Add Keyword Condition" from the displayed menu.
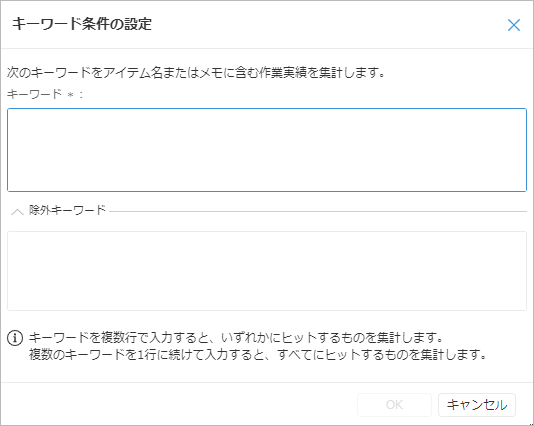
-
Specify the "Keyword" and "Exclude Keyword," then click the "OK" button.
- This function aggregates the man-hours of work that include the string set in "Keywords" in the work item name or performance memo.
- You can specify man-hours to exclude from the aggregation by setting "Excluded Keywords".
-
Select the period to be included in the aggregation from the "Aggregation Period" dropdown list.
Following the above steps, the report shown in the figure below was created.
-
Which time periods are included in "Business Trips," "Meetings," and "Training," which are non-work time?
-
The impact of the above on the plan

Modifying an Existing Report
You can change the settings of the created report later.
The analysis results are always up-to-date, so you can immediately check the following changes.
- The number of projects included in the aggregation has increased.
- Subdivide the man-hours that were previously grouped together.
Optimize your reports to match the changing situation and conduct analysis that aligns with your objectives.
You can change the following:
- Copy the report
- Edit the name
- Change the display color of the group
- Change the aggregation conditions set for the group
- Delete the group or aggregation conditions
- Change the aggregation period
Copying the Report
You can copy the custom reports you have created, which can be used in the following cases:
- Modify the report while keeping the original so you can revert to the original
- Create a similar report
Procedure
- Click "Settings" ①.
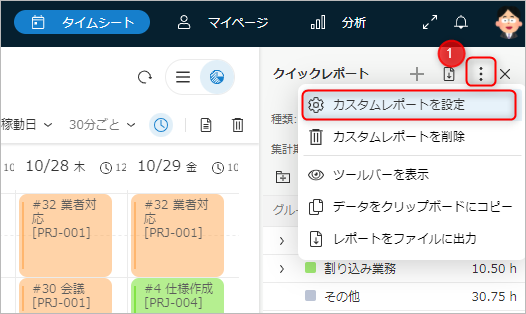
-
Click "Settings Custom Report" from the displayed menu.
-
Select the report to copy in the "Settings Custom Report" dialog box that appears.
-
Click the "Copy" button.
Editing the Name
You can change the name using the following method:
- Click "Settings" ①.

-
Click "Configure Custom Reports" from the displayed menu.
-
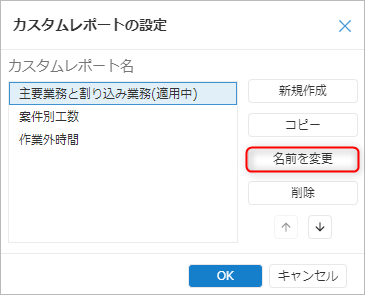
In the "Custom Report Settings" dialog box that appears, select the report whose name you want to change.
-
Click the "Rename" button.
-
In the "Set Name" dialog box, change the name to your desired name and click the "OK" button.
-
Click the "OK" button to close the "Custom Report Settings" dialog box.
Note: To change the group name, click "Settings" ① to the right of the target group.

Changing Display Colors
You can change the colors for each group in a Quick Report using the following method.
By intentionally defining the colors for each group, such as using highly visible colors like red or yellow for items you want to highlight,
the analysis results will become even easier to understand.
- Click "Settings" to the right of the group you want to rename.
- Select "Change Color" and specify the color you want to change from the displayed color palette.
Changing Aggregation Conditions
The conditions defined for the groups aggregated in the report can be changed later.
Changes to the conditions are immediately reflected in the aggregation results, eliminating the need for re-aggregation.
The methods for adding and modifying conditions are as follows:
-
Adding Conditions
This is the same operation as adding conditions to a group when creating a custom report. -
Modifying Conditions
- Click "Settings" to the right of the keyword condition.
- Click "Set Keyword Conditions" from the displayed menu.
- In the "Set Keyword Conditions" dialog box that appears, change the "Keywords" and "Excluded Keywords".
- Click the "OK" button to apply the changes.
-
Moving Conditions Drag and drop the target condition to the group you want to move it to.
Deleting Groups and Aggregation Conditions
You can delete unnecessary conditions and groups, such as when a project is completed.
- Select the group or condition to delete and click the "Delete Selected Elements" icon.
- When deleting a group, the conditions set for that group will also be deleted.
- You can also change the aggregation period. See the following link for details: "Analyzing Man-Hours"
Utilizing Aggregated Data
Data aggregated in Quick Report can be output in the following format.
- Copy to clipboard
- Output as PDF file
These output data can be used in reports for stakeholders.
Copying aggregated data
Copy the aggregated man-hour information using the following method.
Paste it into other applications such as Excel for use.
- Click "Settings".
- Click "Copy data to clipboard".
- Paste the copied data into Excel or another application.
Outputting to PDF file
Output the aggregated man-hour data and graphs to a PDF file.
The output is designed in a report format, allowing for easy information sharing without the need to format the report yourself.
- Click "Settings".
- Click "Output report to file".
Deleting unnecessary reports
Delete reports you no longer need using the following method.
- With the report to be deleted displayed, click the "Settings" ① icon.
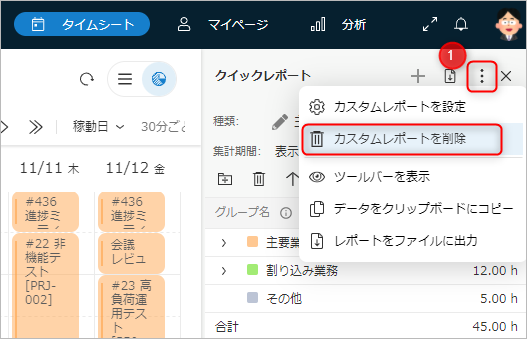
- Select "Delete Custom Report" from the displayed menu.
This operation will delete the currently displayed report, and the built-in report "High-Effort Projects" will be selected.