Creating a project plan
This page introduces how to create a project plan on TimeTracker RX.
Creating a project, adding tasks, etc. are introduced in the following link.
By setting a schedule, etc. for the project created above, you can use it for progress management.
The flow of this page is as follows.
- Set planned times for a task
- Set a schedule for a task
- Customize the display field
1. Set planned times for a task
By setting planned times for a task, you can reflect the amount of work (man-hour scale) of the project in the project.
In addition, by comparing it with the actual times, it can also be used for budget and actual man-hour management.
For example, if the actual effort exceeds the planned effort, the actual effort will be displayed in red.
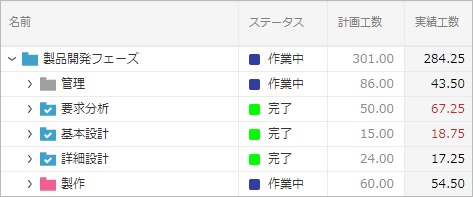
Don't miss any tasks that require your attention.
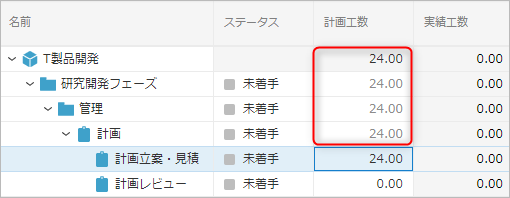
To set the planned effort for a task:
- Select the "Planned effort" column for the task and double-click it.
- Enter the planned effort as a number (in hours).

The planned effort set for a task is automatically reflected in the upper hierarchy of the WBS.
2. Set a schedule for a task
To reflect the project schedule in TimeTracker RX, set a schedule (start date to end date) for the task.
You can also set the dates by double-clicking the "Start Date" and "End Date" columns of the task, but it is more intuitive and easier to set them on the Gantt chart (line chart).
Operation Procedure
- Click the "Show Gantt Chart" icon.
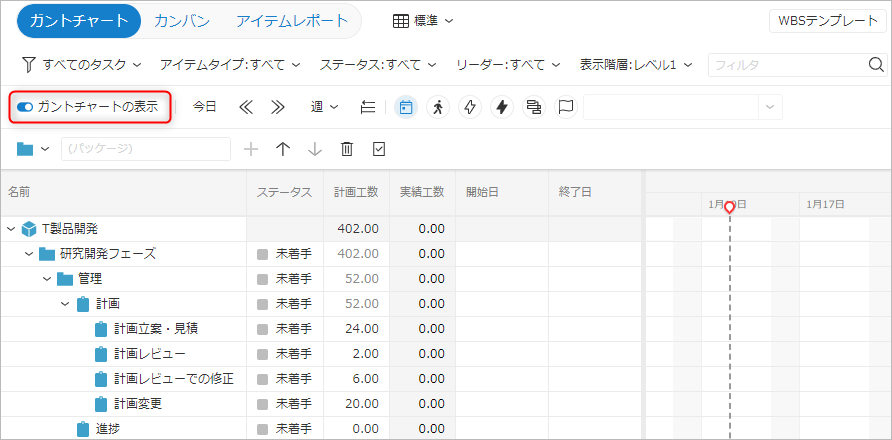
- Drag the border between the table and the Gantt chart to adjust the display range so that the Gantt chart is easier to operate.
- Drag the row of the target task on the Gantt chart.
The period of the dragged range will be set as the task schedule.
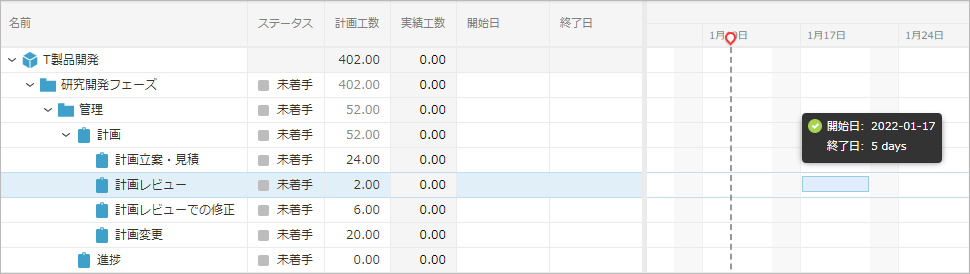
The set schedule (the line on the Gantt chart) can be moved or the period can be enlarged or reduced by dragging.
- The "Day", "Week", and "Month" icons allow you to switch the display unit of the Gantt chart.
- The "Show previous period" and "Show next period" icons allow you to move the display range of the Gantt chart.
- Schedule settings can be set not only for end tasks in the WBS, but also directly for higher-level packages.
For how to output to Excel, please refer to the following link: "Outputting Gantt tables and Gantt charts"
3. Customizing the display fields
In the project screen, you can freely change the configuration of fields (columns) included in the table to make it easier to use according to the business content.
We will introduce how to do this.
- Changing the sort order of fields
You can change the sort order of fields by dragging the field name display part of the header row with the mouse.
You can freely adjust the order as needed, such as moving important fields to the left. - Adding fields to be displayed
In TimeTracker RX, many other fields are available in addition to the fields currently displayed.
The method for adding a field to a table is as follows.
- Click the icon on the right side of the displayed table name.
- Select "Table List Settings".
- In the "Table List Settings" dialog, select the target table and click "Edit".
- Select the field to be displayed from "Field List" and click "→" to add it to "Displayed Fields".
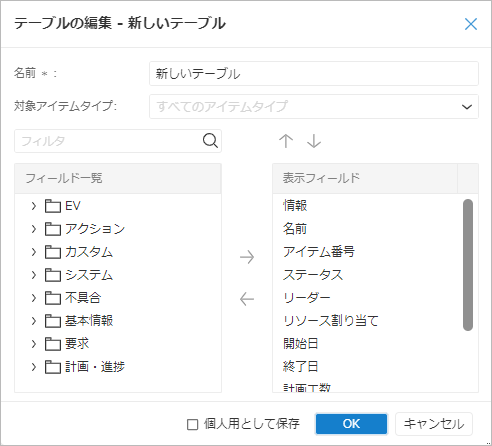
To remove a field from the displayed fields, select the field to be removed from "Displayed Fields" and click "←". - Click the "OK" button.
When changing whether to show or hide a column, you can change the order in which the columns are displayed by clicking "↑" or "↓".
It is also possible to set up multiple tables and switch between them.
If you set up tables for each theme, such as progress management or labor hour management, you can use the project screen simply without increasing the number of display fields more than necessary, which is very convenient.